




Gauteng Provincial GHG Inventory · Scopes 1, 2 & 3 · 2020–2024 · 2026/06
Gauteng Climate Change Act Implementation Reports
Gauteng’s greenhouse gas inventory for 2020–2024, compiled under the 2006 IPCC Guidelines and the GHG Protocol for Communities. The province emitted 105,307 Gg CO₂e in 2024, −1.6% on the 107,025 Gg CO₂e recorded in 2020 — a footprint led in every year of the period by the electricity Gauteng buys from the national grid, alongside direct emissions inside the provincial boundary and the transmission losses and imported waste its consumption drives beyond it.
Prepared by Zutari (Pty) Ltd for the Gauteng Department of Environment (GDEnv). Emissions converted to CO₂e using AR5 100-year global warming potentials.
The Gauteng Provincial Greenhouse Gas (GHG) Inventory presents the province’s emissions and removals for the 2020 - 2024 period. It covers direct emissions generated within Gauteng (Scope 1), indirect emissions from purchased electricity (Scope 2), selected value-chain emissions (Scope 3), and emissions and removals from Land Use, Land-Use Change and Forestry (LULUCF).
The inventory was compiled in accordance with the 2006 IPCC Guidelines for National Greenhouse Gas Inventories, supplemented by the 2019 Refinement to the 2006 IPCC Guidelines for National Greenhouse Gas Inventories. The Global Protocol for Community-Scale Greenhouse Gas Emission Inventories (GPC) was used to define the provincial inventory boundary and classify emissions by scope.
Relevant national methodologies and emission factors published by DFFE were applied where available. Emissions were converted to carbon dioxide equivalent (CO₂e) using the 100-year global warming potentials from the IPCC Fifth Assessment Report (AR5), as adopted in the inventory (Table ES-1).
| Greenhouse gas | Formula | GWP₁₀₀ |
|---|---|---|
| Carbon dioxide | CO₂ | 1 |
| Methane | CH₄ | 28 |
| Nitrous oxide | N₂O | 265 |
Gauteng’s total GHG emissions, excl. LULUCF decreased slightly from 107,025 Gg CO₂e in 2020 to 105,307 Gg CO₂e in 2024. Emissions peaked at 110,670 Gg CO₂e in 2021 before declining to 104,770 Gg CO₂e in 2023 and increasing marginally in 2024. Scope 2 was the largest emissions source throughout the inventory period (Table ES-2).
| Scope | 2020 | 2021 | 2022 | 2023 | 2024 |
|---|---|---|---|---|---|
| Scope 1 | 37,513 | 41,723 | 43,151 | 41,988 | 39,148 |
| Scope 2 | 61,779 | 60,230 | 55,329 | 54,928 | 57,552 |
| Scope 3 | 7,733 | 8,717 | 7,805 | 7,854 | 8,607 |
| Total, excl. LULUCF | 107,025 | 110,670 | 106,285 | 104,770 | 105,307 |
All values are expressed in Gg CO₂e.
Scope 1 emissions increased from 37,513 Gg CO₂e in 2020 to a peak of 43,151 Gg CO₂e in 2022 before declining to 39,148 Gg CO₂e in 2024. Energy was the largest Scope 1 emissions source throughout the period, followed by waste, IPPU and agriculture (Figure ES-1).
As shown in Figure ES-2, Indirect emissions were dominated by purchased electricity (scope 2). Scope 2 emissions decreased from 61,779 Gg CO₂e in 2020 to 54,928 Gg CO₂e in 2023 before increasing to 57,552 Gg CO₂e in 2024. Scope 3 emissions ranged between 7,733 and 8,717 Gg CO₂e and were almost entirely associated with electricity transmission and distribution losses. Emissions from imported waste represented a negligible share.
LULUCF emissions and removals were estimated for 2020 only. The sector recorded net emissions of 2,963 Gg CO₂e, as emissions from Settlements, Grassland and Other Land exceeded removals from Forest Land, Wetlands and Cropland. LULUCF was excluded from the 2021 - 2024 totals because estimates were unavailable for these years.
The Gauteng GHG inventory was compiled using data from the South African Greenhouse Gas Emissions Reporting System (SAGERS), Department of Mineral Resources and Energy (DMRE), Department of Forestry, Fisheries and the Environment (DFFE), Department of Agriculture, Land Reform and Rural Development (DALRRD), South African Waste Information Centre (SAWIC) and other provincial and national sources. Where complete annual data were unavailable, extrapolations and assumptions were applied and documented. The results provide an evidence base for tracking emissions in energy, industrial processes and product use (IPPU), agriculture, land use, land use change and Forestry (LULUCF), and Waste.
1.1 Provincial context
Gauteng is the smallest province in South Africa by land area, covering less than 2% of the country’s total surface area, yet it is the economic hub of the nation. The province is home to an estimated population of over 16 million people, making up about 25.5% of the national population and contributes more than one-third of South Africa’s Gross Domestic Product (GDP). Gauteng includes the major metropolitan municipalities of Johannesburg, Tshwane, and Ekurhuleni, which together form the country’s largest concentration of economic activity, infrastructure, industry, commerce, and services.
As the most urbanised and industrialised province in South Africa, Gauteng attracts significant investment, migration, and development opportunities. However, the same activities that drive economic growth also contribute substantially to greenhouse gas (GHG) emissions. High levels of energy consumption, industrial production, transportation demand, commercial activity, and waste generation result in significant emissions. Understanding the relationship between Gauteng’s economic development and GHG emissions is therefore essential for effective climate change planning and sustainable development within the province.
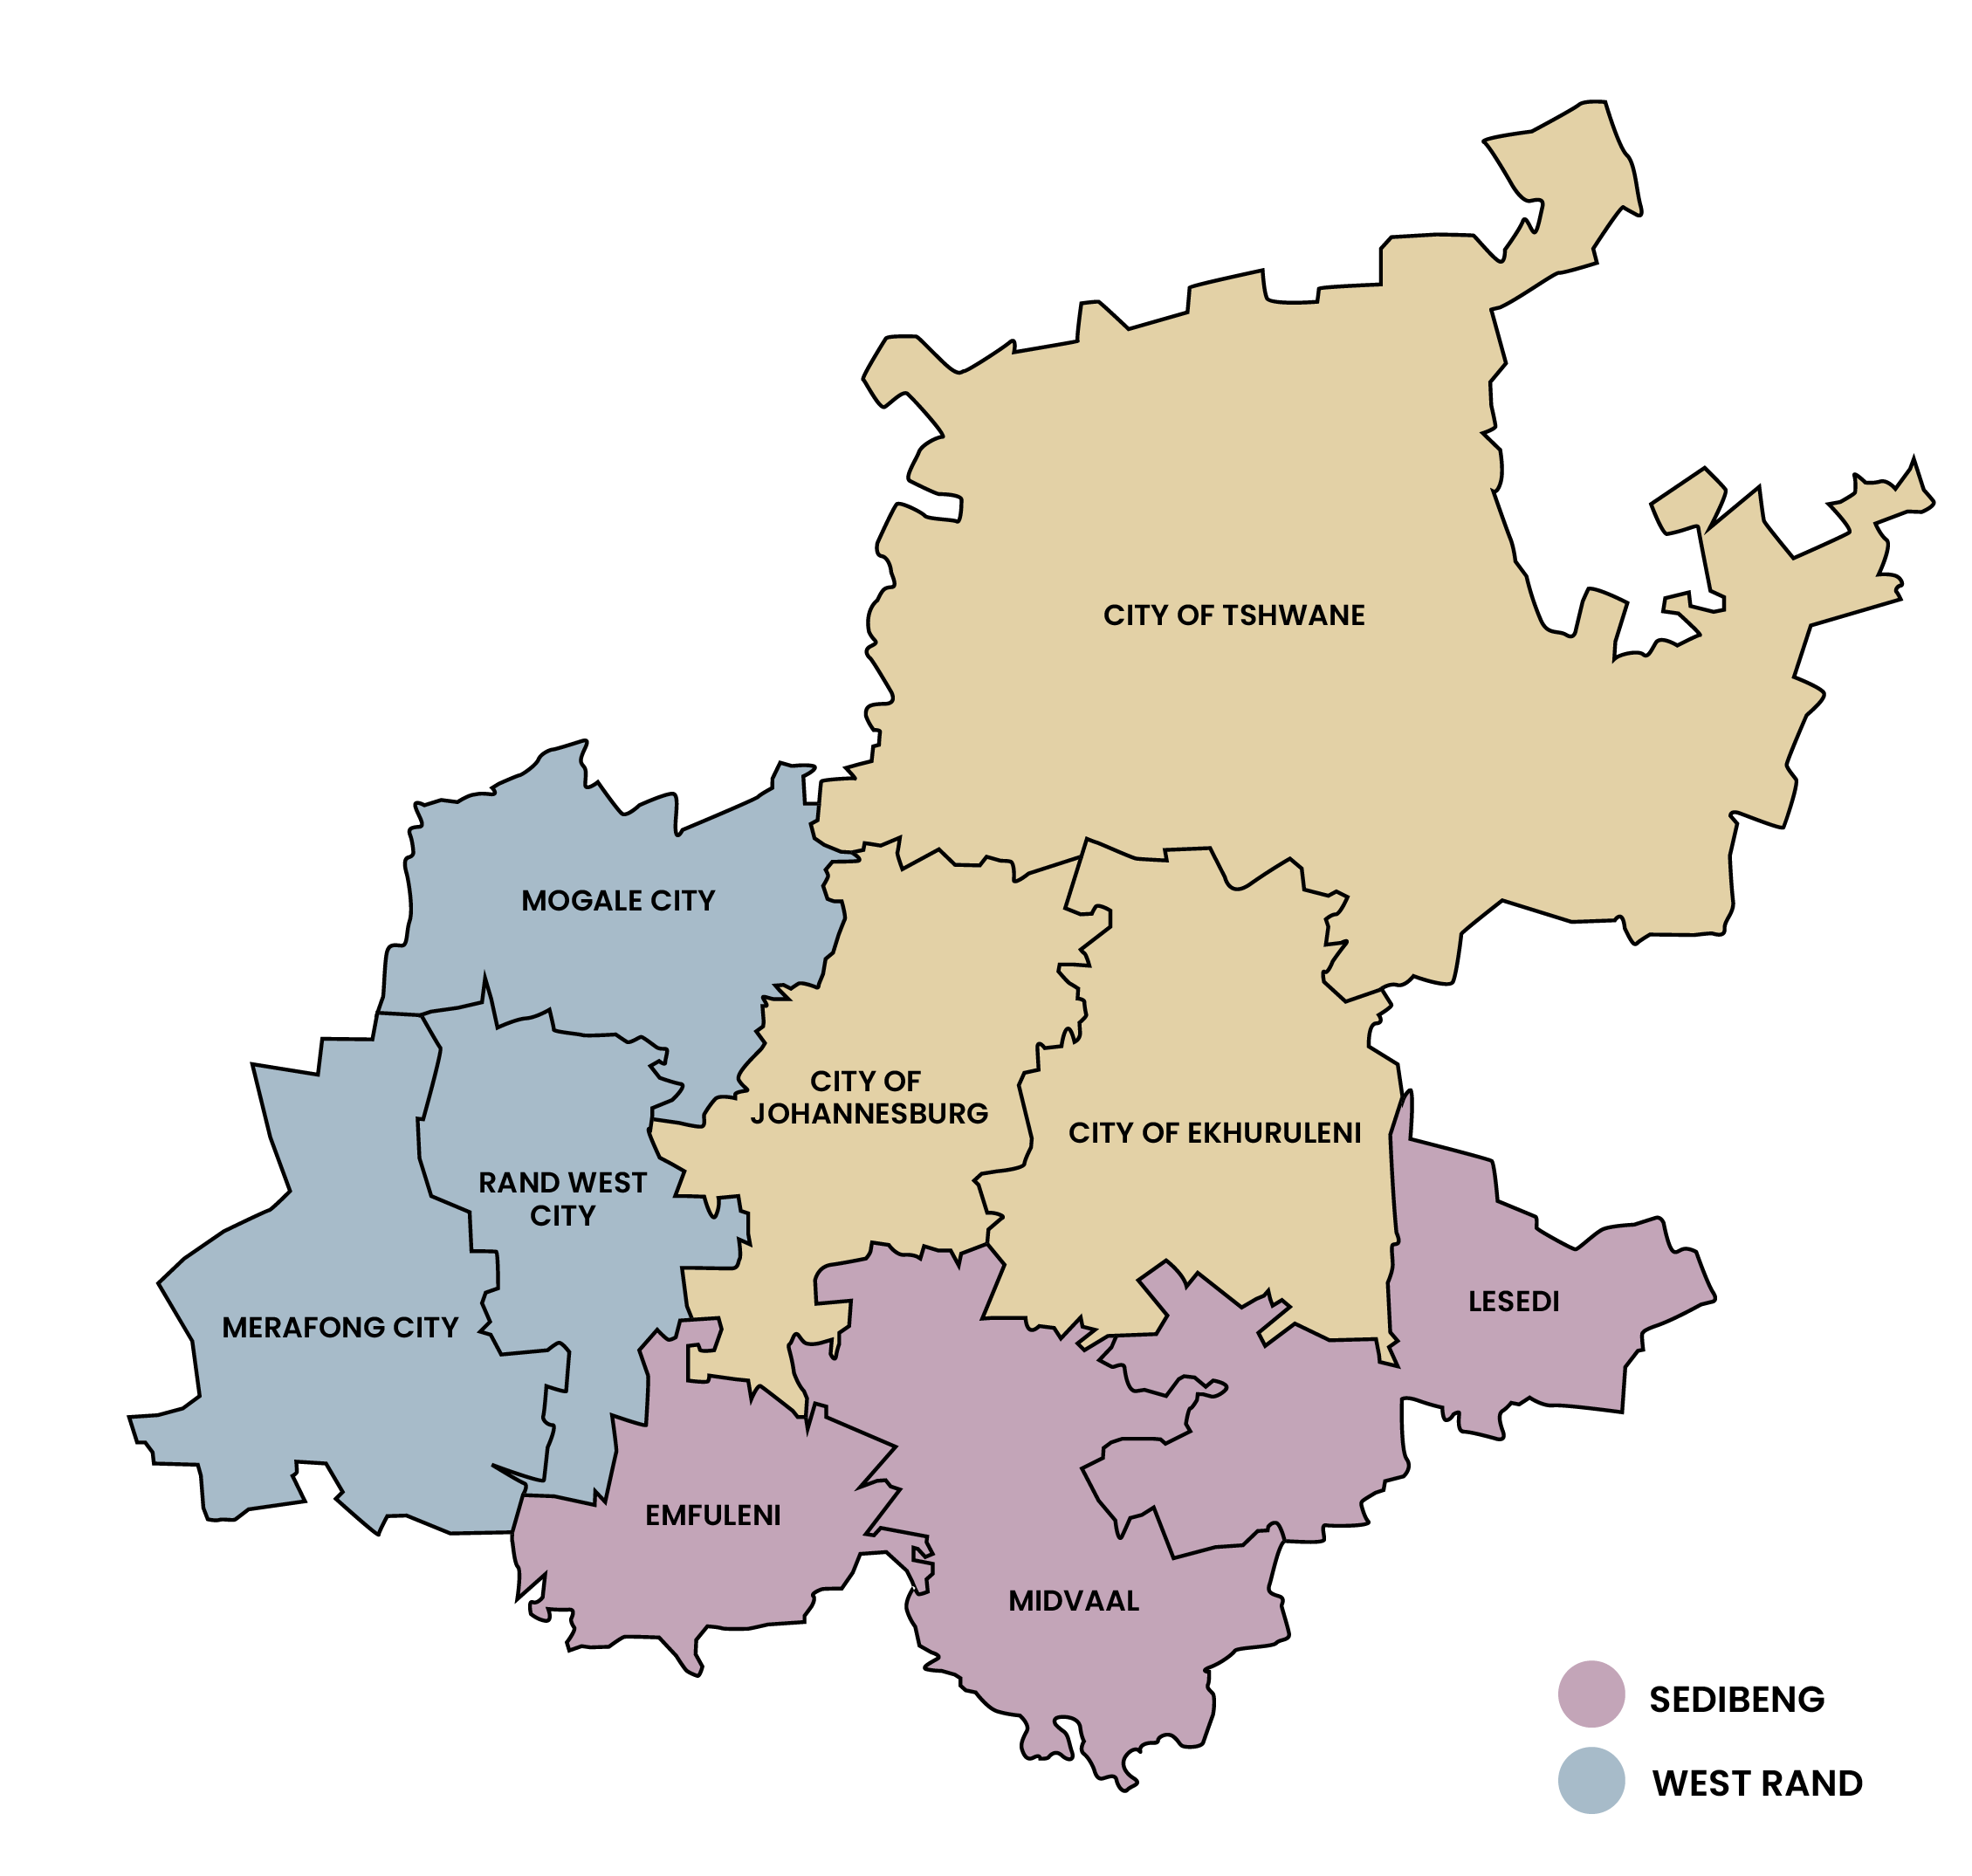
Gauteng’s GHG inventory report covers emissions and removals occurring within the province’s geographical boundary. The inventory covers Gauteng’s three metropolitan municipalities, the City of Johannesburg, City of Tshwane and City of Ekurhuleni, and its two district municipalities, West Rand and Sedibeng, as illustrated in Figure 1-1.
1.2 Background information on climate change
Climate change is one of the most significant environmental, social, and economic challenges facing the world today. The increasing concentration of greenhouse gases (GHGs) in the atmosphere, primarily driven by human activities such as fossil fuel combustion, industrial production, agriculture, and waste management, is driving changes in the global climate system. These changes have farreaching implications, including rising temperatures, increased frequency and intensity of extreme weather events, water insecurity, biodiversity loss, and adverse impacts on human health and economic development. As South Africa's economic hub and most industrialised province, Gauteng plays a critical role in supporting the country's efforts to reduce GHG emissions while promoting sustainable economic growth and climate resilience.
South Africa has demonstrated its commitment to addressing climate change through both international and domestic policy frameworks. As one of the 196 Parties to the Paris Agreement, the country has committed to contributing to the global effort to limit the increase in average global temperatures by reducing GHG emissions and strengthening resilience to climate change. Under the Paris Agreement, Parties are required to prepare, communicate, and periodically update their Nationally Determined Contributions (NDCs), which outline national climate mitigation and adaptation commitments
South Africa's first Nationally Determined Contribution (NDC), submitted in 2015, committed the country to limiting national GHG emissions to a range of 398 - 614 MtCO₂e for both 2025 and 2030. In response to increasing scientific evidence and the global ambition to accelerate climate action, South Africa submitted an updated NDC in September 2021, strengthening its mitigation commitments. The revised targets reduced the emissions range for 2025 to 398 - 510 MtCO₂e and for 2030 to 350 - 420 MtCO₂e, representing a substantial increase in ambition compared to the original commitments. Achieving these targets requires coordinated action across all spheres of government and economic sectors, supported by GHG inventories that enable the monitoring of emissions trends and the identification of mitigation opportunities.
A significant milestone in South Africa's climate governance framework was the promulgation of the Climate Change Act, 2024 (Act No. 22 of 2024) in July 2024. The Act establishes a comprehensive legal framework to support an effective national climate change response and facilitate South Africa's transition towards a low-carbon, climate-resilient economy and society. Building upon the principles and provisions of the National Environmental Management Act, the Climate Change Act provides for integrated climate change governance across national, provincial, and municipal spheres of government. It also promotes GHG emissions reduction, climate risk assessment, and coordinated planning to ensure that climate considerations are incorporated into development planning and decision-making processes.
1.3 Background information on GHG Inventories
Within the Climate Change Act context, provincial GHG inventories have become increasingly important. They contribute to improving the quality of national GHG reporting by providing more detailed and accurate sub-national data. The primary objective of this inventory is to establish a transparent, consistent, and credible estimate of Gauteng's GHG emissions and removals for the 2020–2024 period. This GHG Inventory presents an assessment of GHG emissions and removals for Gauteng Province using activity data for the period 2020 to 2024. The inventory has been compiled using the 2006 Intergovernmental Panel on Climate Change (IPCC) Guidelines for National GHG Inventories. The 2006 IPCC Guidelines were adopted to ensure methodological consistency with previous provincial GHG inventories and to facilitate the comparison of emissions trends over time.
The last Gauteng GHG inventory was compiled in 2024. This inventory uses the 2006 IPCC Guidelines. The inventory accounts exclusively for Scope 1 (direct) GHG emissions occurring within the provincial boundary. As such, it excludes Scope 2 emissions associated with purchased electricity, steam, heating, or cooling, as well as any other indirect emissions (Scope 3). The inventory therefore provides a baseline assessment of direct emissions generated by activities within Gauteng Province, forming the foundation for future emissions tracking, reporting, and climate change mitigation planning.
Building on this baseline, the current Gauteng provincial GHG Inventory covering the period 2020–2024 has been developed using the same methodological approach and IPCC Guidelines to ensure consistency and comparability with the previous inventory. However, the scope of the inventory has been expanded to include Scope 2 emissions from purchased electricity, and Scope 3 emissions from electricity losses (distribution and transmission), as well as waste imported (landfilled). The inclusion of indirect emissions provides a more comprehensive representation of Gauteng's GHG footprint by capturing emissions associated with energy consumption and other activities that occur outside the provincial boundary but are driven by economic activities within the province.
1.4 Institutional arrangements for Gauteng GHG Inventory preparations
The Gauteng Department of Environment (GDEnv) is responsible for the coordination and management of the provincial GHG Inventory as part of the province’s climate change mitigation planning, monitoring, reporting, and evaluation functions. The Department leads the compilation, quality assurance, and publication of the provincial GHG inventory, ensuring that the inventory is developed in accordance with nationally approved methodologies and international good practice.
Although the GDEnv plays the lead role in compiling and reporting the provincial GHG inventory, the successful preparation of the inventory relies on collaboration with a range of provincial departments, municipalities, state-owned entities, and other relevant institutions. Moreover, the Department coordinates data collection, engaging with data providers and undertaking quality control. This collaborative institutional arrangement strengthens the transparency, consistency, completeness, and accuracy of the inventory.
1.5 Objective of the project
The primary objective of the project is to develop a Gauteng Provincial GHG Inventory. This includes compiling and analysing activity data to estimate provincial GHG emissions and removals, preparing a comprehensive and transparent inventory, and identifying data gaps and opportunities for improving future inventory development and reporting.
1.6 Purpose of the Report
The purpose of this report is to present a comprehensive assessment of GHG emissions and removals within Gauteng Province by quantifying emissions across the relevant IPCC sectors (Energy, IPPU, AFOLU and Waste sectors). The report provides the province’s emissions profile using approved GHG inventory methodologies and activity data. It identifies the sources and sinks of emissions and highlights areas where data quality and reporting can be improved. The GHG inventory serves as an important evidence base for emissions reduction planning and the monitoring of mitigation interventions. Furthermore, it supports compliance with the requirements of the Climate Change Act, strengthens provincial GHG monitoring and reporting systems, and contributes to South Africa's national GHG inventory and climate change commitments
2.1 Inventory Boundary
The GHG emissions inventory for the Gauteng province over the 2020 - 2024 period follows both the 2006 IPCC guidelines1 and the Global Protocol for Community-Scale Greenhouse Gas Emission Inventories: An accounting and Reporting Standard for Cities which was developed by the World Resources Institute (WRI 2014)2.
The inventory provides an overview of the provincial GHG footprint by emission scope and sector. Scope 1, 2 and 3 emissions are presented to illustrate the relative contribution of direct and indirect emission sources to the overall provincial GHG footprint. Scope 1 emissions are further disaggregated by IPCC sector and source category to identify the major contributors to direct GHG emissions within the province. A summary of the emission scopes and source categories included in the inventory is presented below:
| Scope 1 | Scope 2 | Scope 3 |
|---|---|---|
| Agriculture, forestry and other land use | Grid-supplied electricity (delivered / consumed in Gauteng) | Waste generated outside the province and imported into Gauteng |
| Stationary and mobile fuel combustion (in-boundary transportation) | Transmission and distribution losses | |
| Industrial processes and product use (IPPU) | ||
| Waste generated and disposed inside Gauteng |
A detailed description of the methodologies, activity data, emission factors, assumptions and equations applied to estimate emissions for each source category is provided in the Methodology for Calculating GHG Emissions for the Gauteng Province section.
2.2 Overview of Gauteng GHG Emissions
The Gauteng GHG footprint consisted of direct (Scope 1), indirect electricity-related (Scope 2) and selected value chain (Scope 3) emissions. Total GHG emissions by scope over the 2020 - 2024 inventory period are presented in Table 2-2 and Error! Reference source not found.
Scope 2 emissions accounted for the largest share of Gauteng’s total GHG emissions (excl. LULUCF) throughout the inventory period, reflecting Gauteng's reliance on electricity supplied through South Africa's predominantly fossil fuel-based national grid. Scope 1 emissions were the second-largest contributor to Gauteng GHG emissions in the inventory period and included direct GHG emissions from sources within the provincial boundary (Energy, IPPU, Agriculture and Waste). Scope 3 emissions accounted for the smallest share of the provincial GHG footprint throughout the inventory period. The major contributor to scope 3 emissions are emissions from electricity transmission and distribution losses, while emissions from imported waste contributes only a small proportion of total Scope 3 emissions
| Scope | 2020 | 2021 | 2022 | 2023 | 2024 |
|---|---|---|---|---|---|
| Scope 1 | 37,513 | 41,723 | 43,151 | 41,988 | 39,148 |
| Scope 2 | 61,779 | 60,230 | 55,329 | 54,928 | 57,552 |
| Scope 3 | 7,733 | 8,717 | 7,805 | 7,854 | 8,607 |
| Total | 107,025 | 110,670 | 106,285 | 104,770 | 105,307 |
2.2.1 Emissions breakdown by sector
In 2024, Gauteng's GHG emissions totalled 105,307 Gg CO₂e, excl. LULUCF. As shown in Figure 2-2, scope 2 emissions from purchased electricity represented the largest share (55%) of total GHG emissions, scope 1 emissions accounted for 37% of the inventory and were primarily generated by the Energy sector (transport, stationary combustion and fugitive sources), followed by the Waste, IPPU and Agriculture sectors, scope 3 emissions contributed the remaining 8% of total emissions and were almost entirely associated with electricity transmission and distribution (T&D) losses, while imported waste represented a negligible share. As shown in Table 2-3, this distribution of emissions remained broadly consistent across the 2020 - 2024 inventory period.
| Scope | Emission source | 2020 | 2021 | 2022 | 2023 | 2024 |
|---|---|---|---|---|---|---|
| Scope 1 | Energy — transport | 16,559 | 18,438 | 19,123 | 18,545 | 17,859 |
| Energy — stationary | 3,746 | 6,291 | 5,839 | 5,472 | 4,761 | |
| Energy — fugitive | 0 | 352 | 0.081 | 0.001 | 0.65 | |
| Waste | 11,515 | 11,076 | 11,341 | 11,711 | 10,284 | |
| IPPU | 4,861 | 4,105 | 5,503 | 5,136 | 4,698 | |
| Agriculture | 832 | 1,462 | 1,344 | 1,124 | 1,544 | |
| Scope 2 | Electricity purchased | 61,779 | 60,230 | 55,329 | 54,928 | 57,552 |
| Scope 3 | T&D losses | 7,727 | 8,656 | 7,798 | 7,848 | 8,583 |
| Waste imported | 6 | 62 | 7 | 6 | 25 | |
| Total | 107,025 | 110,672 | 106,284 | 104,770 | 105,307 | |
2.3 Scope 1 GHG Emissions
Scope 1 emissions are all direct emissions sources located within the geographical boundary of the Gauteng province. The direct sources of emissions include agriculture, stationary and mobile fuel combustion (in-boundary transportation), industrial processes and product use, and waste generated and disposed inside Gauteng. The Scope 1 emissions presented in this section are reported in accordance with the IPCC sector codes and categories and represent only direct emissions occurring within the provincial boundary. Indirect emissions (scope 2 and 3) are presented in the subsequent sections of this chapter.
2.3.1 GHG Emissions and Trends by IPCC sector
Table 2-4 and Figure 2-3 present the total Scope 1 GHG emissions by IPCC sector over the 2020 - 2024 inventory period.
| IPCC categories | GHG Emissions (Gg CO₂e) | |||||
|---|---|---|---|---|---|---|
| 2020 | 2021 | 2022 | 2023 | 2024 | ||
| TOTAL (excl. LULUCF) | 37,513 | 41,723 | 43,151 | 41,988 | 39,148 | |
| TOTAL (incl. LULUCF) | 43,986 | 41,723 | 43,151 | 41,988 | 39,148 | |
| 1 | ENERGY | 20,305 | 25,080 | 24,963 | 24,017 | 22,621 |
| 1A1 | Energy Industries | 375 | 2,246 | 1,582 | 1,963 | 1,640 |
| 1A2 | Manufacturing Industries & Construction | 3,192 | 3,496 | 3,547 | 2,999 | 2,726 |
| 1A3 | Transportation | 16,559 | 18,438 | 19,123 | 18,545 | 17,859 |
| 1A4 | Other Industries | 180 | 549 | 709 | 510 | 395 |
| 1A5 | Non-Specified | - | 0.496 | 0.731 | - | - |
| 1B | Fugitive Emissions | - | 352 | 0.081 | 0.001 | 0.645 |
| 2 | IPPU | 4,861 | 4,105 | 5,503 | 5,136 | 4,698 |
| 2A3 | Glass Production | 90 | 136 | 76 | 75 | 73 |
| 2A4 | Other Process Uses of Carbonates | 239 | 241 | 275 | 215 | 225 |
| 2B2 | Nitric Acid Production | 0.141 | 0.260 | 0.193 | 0.110 | - |
| 2C1 | Iron and Steel Production | 4,500 | 3,684 | 5,117 | 4,822 | 4,376 |
| 2C2 | Ferroalloys Production | 28 | 37 | 28 | 24 | 24 |
| 2C5 | Lead Production | 3.4 | 7.2 | 6.4 | - | - |
| 3 | AGRICULTURE | 832 | 1,462 | 1,344 | 1,124 | 1,544 |
| 3A1 | Enteric Fermentation | 700 | 1,325 | 1,205 | 984 | 1,397 |
| 3A2 | Manure Management | 29 | 29 | 29 | 30 | 29 |
| 3C2 | Liming | 41 | 44 | 46 | 46 | 51 |
| 3C4 | Direct N₂O Emissions from Managed Soils | 30 | 31 | 32 | 32 | 34 |
| 3C5 | Indirect N₂O Emissions from Managed Soils | 11 | 11 | 12 | 11 | 12 |
| 3C6 | Indirect N₂O Emissions from Manure Management | 21 | 21 | 21 | 21 | 21 |
| LULUCF | 6,473 | NE | NE | NE | NE | |
| 4A | Forest Land | -923 | ||||
| 4B | Cropland | 1,797 | ||||
| 4C | Grassland | 2,219 | ||||
| 4D | Wetlands | -642 | ||||
| 4E | Settlements | 3,661 | ||||
| 4F | Other Land | 361 | ||||
| 5 | WASTE | 11,515 | 11,076 | 11,341 | 11,711 | 10,284 |
| 5A | Solid Waste Disposal | 5,384 | 5,471 | 5,460 | 5,661 | 5,762 |
| 5B | Biological Treatment of Solid Waste | 239 | 212 | 274 | 305 | 362 |
| 5C | Incineration and Open Burning of Waste | 352 | 357 | 375 | 370 | 376 |
| 5D | Wastewater Treatment and Discharge | 5,541 | 5,035 | 5,232 | 5,374 | 3,783 |
2.3.1.1 Energy GHG Emissions (2024)
The Energy sector includes GHG emissions from stationary fuel combustion, mobile fuel combustion, fugitive sources and other fuel combustion activities occurring within the provincial boundary. In 2024, the Energy sector emitted 22,621 Gg CO₂e, accounting for approximately 58% of total Scope 1 emissions and 21% of the total provincial GHG footprint. The contribution of each Energy source category is presented in Figure 2-4.
- Transportation was the largest source of Energy sector emissions, contributing 17,859 Gg CO₂e (approximately 79%) of total Energy sector emissions. Road transportation accounted for almost all transport-related emissions, while domestic aviation contributed a comparatively small proportion.
- Manufacturing Industries and Construction was the second-largest contributor, emitting 2,726 Gg CO₂e (approximately 12%) of total Energy sector emissions. Emissions were generated across several industrial subsectors, including iron and steel, chemicals, non-metallic minerals, food processing, mining, and pulp and paper.
- Energy Industries contributed 1,640 Gg CO₂e (approximately 7%) of total Energy sector emissions, with emissions primarily associated with electricity generation.
- Other Industries, Non-Specified and Fugitive Emissions together accounted for the remaining 2% of Energy sector emissions, indicating a comparatively minor contribution to the overall Energy emissions profile.
- Energy Industries
- Manufacturing Industries & Construction
- Transportation
- Other Industries
- Non-Specified
- Fugitive Emissions
2.3.1.2 IPPU GHG Emissions (2024)
The IPPU sector includes GHG emissions released from industrial processes and the use of products, excluding emissions associated with fuel combustion. In 2024, the IPPU sector emitted 4,698 Gg CO2e, accounting for approximately 12% of total Scope 1 emissions and 4.5% of the total provincial GHG footprint. The contribution of each IPPU source category is presented in Figure 2-5.
- Iron and Steel Production was the dominant source of IPPU emissions, contributing approximately 93% of total IPPU emissions. This reflects the significant contribution of iron and steel manufacturing activities to the provincial industrial emissions profile.
- Other Process Uses of Carbonates was the second-largest contributor, accounting for approximately 5% of total IPPU emissions.
- Glass Production contributed approximately 2% of total IPPU emissions.
- Nitric Acid Production, Ferroalloys Production and Lead Production together accounted for a negligible proportion of total IPPU emissions, indicating a comparatively minor contribution to the overall IPPU emissions profile.
- Glass Production
- Other Process Uses of Carbonates
- Nitric Acid Production
- Iron and Steel Production
- Ferroalloys Production
- Lead Production
2.3.1.3 Agriculture, excl LULUCF GHG Emissions (2024)
The agriculture sector includes GHG emissions associated with livestock production and managed agricultural soils. In 2024, the agriculture sector emitted 1,544 Gg CO2e, accounting for approximately 4% of total Scope 1 emissions and 1.5% of the total provincial GHG footprint. The contribution of each agricultural source category is presented in Figure 2-6.
- Enteric Fermentation was the dominant source of agricultural emissions, contributing approximately 91% of total Agriculture sector emissions. This reflects the significant contribution of methane emissions from livestock digestion, particularly cattle.
- Liming was the second-largest contributor, accounting for approximately 3% of total Agriculture sector emissions.
- Indirect N₂O Emissions from Managed Soils and Indirect N₂O Emissions from Manure Management each accounted for approximately 1% of total Agriculture sector emissions, indicating a comparatively minor contribution to the overall agricultural emissions profile.
- Enteric Fermentation
- Manure Management
- Liming
- Direct N₂O Emissions from Managed Soils
- Indirect N₂O Emissions from Managed Soils
- Indirect N₂O Emissions from Manure Management
2.3.1.4 Land Use and Land Use Change (2020)
The LULUCF sector accounted for net emissions of approximately 6,473 Gg CO2e in 2020. Figure 2-7 presents the contribution of each land-use category to the sector’s net emissions. Positive values represent emissions, while negative values represent removals from the atmosphere.
In 2020, settlements were the largest net emissions source, emitting 3,661 Gg CO2e. Cropland, grassland and other land were also net sources, with net emissions of 1,797 Gg CO2e, 2,219 Gg CO2e and 361 Gg CO2e, respectively. These emissions were partly offset by removals from Forest Land and Cropland. Forest Land accounted for the largest removals at 923 Gg CO2e, followed by Wetlands at 642 Gg CO2e.
The GHG emissions and removals in the LULUCF are calculated using a minimum of 20 years data. Collection of these data is done periodically and is aligned with the DFFE reporting. The last reporting used the 2020 data. In the interim between the reporting periods, the emissions and removals for the latest reporting can be assumed.
2.3.1.5 Waste GHG Emissions (2024)
The Waste sector includes GHG emissions from solid waste disposal, biological treatment of solid waste, incineration and open burning of waste, and wastewater treatment and discharge. In 2024, the Waste sector emitted 10,284 Gg CO₂e, accounting for approximately 26% of total Scope 1 emissions and 9.8% of the total provincial GHG footprint. The contribution of each waste source category is presented in Figure 2-8.
- Solid Waste Disposal was the largest source of Waste sector emissions, contributing approximately 56% of total Waste sector emissions. This reflects methane emissions generated from the anaerobic decomposition of organic waste disposed at landfill sites.
- Wastewater Treatment and Discharge was the second-largest contributor, accounting for approximately 37% of total Waste sector emissions.
- Incineration and Open Burning of Waste contributed approximately 4% of total Waste sector emissions.
- Biological Treatment of Solid Waste accounted for approximately 3% of total Waste sector emissions, indicating a comparatively minor contribution to the overall Waste emissions profile.
- Solid Waste Disposal
- Biological Treatment of Solid Waste
- Incineration and Open Burning of Waste
- Wastewater Treatment and Discharge
2.4 Scope 2 GHG Emissions
Scope 2 emissions are indirect GHG emissions associated with the consumption of purchased electricity within Gauteng. Annual electricity consumption and the corresponding Scope 2 GHG emissions for the 2020 - 2024 inventory period are presented in Table 2-5Error! Reference source not found. below.
Scope 2 emissions accounted for the largest share of the Gauteng GHG footprint throughout the inventory period (more than 50% annually). Emissions decreased from 61,779 Gg CO2e in 2020 to 54,928 Gg CO2e in 2023, before increasing to 57,552 Gg CO2e in 2024. This trend closely reflects changes in provincial electricity consumption, which declined from 57,203 GWh in 2020 to 51,819 GWh in 2023 before increasing to 53,289 GWh in 2024.
| Parameter | Unit | 2020 | 2021 | 2022 | 2023 | 2024 |
|---|---|---|---|---|---|---|
| Electricity consumed | GWh | 57,203 | 57,913 | 54,781 | 51,819 | 53,289 |
| Scope 2 emissions | Gg CO₂e | 61,779 | 60,230 | 55,329 | 54,928 | 57,552 |
2.5 Scope 3 GHG Emissions
The sources of Scope 3 GHG emissions included in this inventory are electricity transmission and distribution (T&D) losses and imported waste disposed within Gauteng. Electricity T&D losses are indirect emissions associated with electricity lost as heat during transmission and distribution from the point of generation to end users. Imported waste refers to municipal solid waste generated outside Gauteng but disposed of at waste disposal facilities within the province. Annual Scope 3 emissions for the 2020 - 2024 inventory period are presented in Table 2-6 and Table 2-7.
- Electricity transmission and distribution losses were the dominant source of Scope 3 emissions throughout the inventory period, accounting for more than 99% of total Scope 3 emissions.
- Waste imported emissions were comparatively small, contributing less than 1% of total Scope 3 emissions over the inventory period. Although the quantity of imported waste varied between years, its contribution to total Scope 3 emissions remained negligible.
| Parameter | Unit | 2020 | 2021 | 2022 | 2023 | 2024 |
|---|---|---|---|---|---|---|
| T&D losses | GWh | 7,155 | 8,323 | 7,721 | 7,404 | 7,947 |
| Scope 3 emissions | Gg CO₂e | 7,727 | 8,656 | 7,798 | 7,848 | 8,583 |
| Parameter | Unit | 2020 | 2021 | 2022 | 2023 | 2024 |
|---|---|---|---|---|---|---|
| Imported waste | tonnes | 5,575 | 58,117 | 6,535 | 5,782 | 23,226 |
| Scope 3 emissions | Gg CO₂e | 6 | 62 | 7 | 6 | 25 |
1 ENERGY
This section describes the methodology and assumptions used to estimate emissions for energy. The energy sector includes emissions from fuel combustion and fugitive emissions from fuels. This coversfuel combustion activities across all sectors, as well as fugitive emissions related to the production, processing, transmission, storage, and distribution of fuels. IPCC Energy Categories Included in the Gauteng GHG Inventory are:
- 1A1 Energy Industries
- 1A2 Manufacturing Industries and Construction
- 1A3 Transportation
- 1A4 Other Industries
- 1A5 Non-specified Industries
- 1B Fugitive Emissions
1.1 Methodology
Energy sector emissions were estimated using a combination of emissions data reported through the South African Greenhouse Gas Emissions Reporting System (SAGERS) and fuel consumption data from the Department of Mineral Resources and Energy (DMRE).
SAGERS-reported emissions were used directly following data checks to confirm the correct classification of records by inventory year, province, municipality and IPCC category. The reported emissions were then aggregated by year and IPCC category. DMRE fuel consumption data were disaggregated by fuel type and allocated to the relevant IPCC source categories. Total Energy sector emissions were therefore derived as the sum of emissions reported through SAGERS and emissions calculated from the DMRE fuel consumption data.
Emissions from fuel consumption reported by the DMRE were estimated by applying the relevant net calorific values, emission factors and GWPs to the quantity of fuel consumed, as shown below:
GHG Emissions = Σᵢ (Fuel consumption × NCV × EFᵢ) × GWPᵢ- i
- Greenhouse gas type
- Fuel consumption
- Quantity of fuel consumed (litres)
- NCV
- Net Calorific Value of the fuel (TJ/litre)
- EFᵢ
- Emission factor for the greenhouse gas type i (kg gas/TJ)
- GWPᵢ
- Global Warming Potential of the greenhouse gas type i (1 for CO₂, 28 for CH₄ and 265 for N₂O)
Following the classification and calculation steps described above, emissions derived from DMRE fuel consumption data and emissions reported through SAGERS were aggregated by inventory year and IPCC source category to determine total Energy sector emissions for Gauteng. The resulting emissions were reported as carbon dioxide equivalent (CO₂e) using the global warming potentials adopted for the inventory.
1.2 Activity Data
- The main data sources for the Energy sector were SAGERs and DMRE.
- SAGERS provides activity data and emissions data by year, sector, IPCC code, activity detail, province, and municipality. For this inventory, subcategories associated with IPCC codes falling within the Energy sector were identified and grouped accordingly within the Energy sector.
- The SAGERS data used in this inventory are confidential and not publicly available. The data were provided by DFFE to the Province specifically for preparing the provincial GHG inventory. Accordingly, only aggregated SAGERS emissions results are presented in this report
- Fuel sales volume data were obtained from the DMRE’s publicly available SA Fuel Sales Volume database. The quarterly disaggregated datasets provide fuel sales by magisterial district and fuel type. Records were mapped to the relevant provincial districts, aggregated by inventory year and allocated to the appropriate IPCC Energy categories. Emissions were then estimated using the methodology described above.
| Units: Liters | ||||||||
|---|---|---|---|---|---|---|---|---|
| Province | Year | Jet Fuel | Aviation Gasoline | Diesel | Furnace Oil | LPG | Paraffin | Petrol |
| Gauteng | 2020 | 530,249,070 | 728,798 | 2,950,670,842 | 122,781,387 | 9,667,831 | 61,894,310 | 3,135,066,821 |
| 2021 | 504,497,154 | 1,045,164 | 3,205,191,324 | 76,098,745 | 17,746,778 | 140,180,989 | 3,440,817,407 | |
| 2022 | 683,254,457 | 224,420 | 3,278,990,502 | 74,095,118 | 42,078,045 | 152,784,773 | 3,530,440,257 | |
| 2023 | 837,769,570 | 87,265 | 3,368,248,356 | 54,123,343 | 24,781,245 | 178,826,735 | 3,502,774,899 | |
1.3 Emission Factors
- For SAGERS data, emissions were already provided in the dataset. Therefore, no additional emission factors were applied to the SAGERS-reported emissions. SAGERs uses country-specific and IPCC default emission factors, as shown in the table below:
| Fuel | Emission Factors (kg GHG/TJ) | Methodology Tiers | ||||
|---|---|---|---|---|---|---|
| CH₄ | CO₂ | N₂O | CH₄ | CO₂ | N₂O | |
| Other Biogas | 1 | 54,600 | 0.1 | 1 | 1 | 1 |
| Sasol Gas (Mrg) | 0 | 54,888 | 0 | 2 | 2 | 2 |
| Sasol Gas (Mrg) | 1 | 54,891 | 0.1 | 1 | 2 | 1 |
| Natural Gas | 1 | 55,664 | 0.1 | 1 | 2 | 1 |
| Natural Gas | 1 | 55,709 | 0.1 | 1 | 2 | 1 |
| Natural Gas | 1 | 56,100 | 0.1 | 1 | 1 | 1 |
| Liquefied Petroleum Gases | 0 | 63,100 | 0 | 3 | 3 | 3 |
| Paraffin | 3 | 64,640 | 0.6 | 1 | 2 | 1 |
| Liquefied Petroleum Gases | 1 | 64,852 | 0.1 | 1 | 1 | 1 |
| Acetylene | 3 | 67,870 | 0.6 | 1 | 2 | 1 |
| Petrol | 3 | 69,300 | 0.6 | 1 | 1 | 1 |
| Jet Kerosene | 3 | 71,500 | 0.6 | 1 | 1 | 1 |
| Other Kerosene | 3 | 71,900 | 0.6 | 1 | 1 | 1 |
| Petrol | 0 | 72,430 | 0 | 2 | 2 | 2 |
| Residual Fuel Oil (Heavy Fuel Oil) | 3 | 73,090 | 0.6 | 1 | 1 | 1 |
| Waste Oils | 30 | 73,300 | 4 | 1 | 3 | 1 |
| Jet Kerosene | 0 | 73,463 | 2 | 2 | 2 | 2 |
| Other (Polyfuel) | 3 | 73,805 | 0.6 | 1 | 1 | 1 |
| Other Bituminous Coal | 1 | 73,940 | 1.5 | 1 | 3 | 1 |
| Diesel | 3 | 74,100 | 0.6 | 1 | 1 | 1 |
| Other Bituminous Coal | 1 | 74,483 | 1.5 | 1 | 3 | 1 |
| Diesel | 3 | 74,638 | 0.6 | 1 | 2 | 1 |
| Used Oil | 1 | 75,700 | 1.5 | 1 | 1 | 1 |
| Other Bituminous Coal | 1 | 75,842 | 1.5 | 1 | 3 | 1 |
| Sasol Fuel Oil 10 | 3 | 75,897 | 0.6 | 1 | 2 | 1 |
| Residual Fuel Oil (Heavy Fuel Oil) | 3 | 77,400 | 0.6 | 1 | 1 | 1 |
| Sasol Ls-Hfo | 3 | 77,638 | 0.6 | 1 | 2 | 1 |
| Other Bituminous Coal | 1 | 78,412 | 1.5 | 1 | 3 | 1 |
| Other Bituminous Coal | 1 | 78,906 | 1.5 | 1 | 3 | 1 |
| Coal Tar | 1 | 80,700 | 1.5 | 1 | 1 | 1 |
| Other Bituminous Coal | 1 | 82,912 | 1.5 | 1 | 2 | 1 |
| Coal Slurry | 1 | 83,330 | 1.5 | 3 | 3 | 3 |
| Tyre | 1 | 85,000 | 1.5 | 1 | 2 | 1 |
| Other Bituminous Coal | 1 | 92,093 | 1.5 | 3 | 3 | 3 |
| Anthracite | 1 | 93,331 | 1.5 | 1 | 1 | 1 |
| Coking Coal | 1 | 94,600 | 1.5 | 1 | 1 | 1 |
| Sub-Bituminous Coal | 1 | 96,100 | 1.5 | 1 | 1 | 1 |
| Sub -Bituminous Coal | 1 | 96,733 | 1.5 | 1 | 2 | 1 |
| Sub-Bituminous Coal | 1 | 96,773 | 1.5 | 1 | 1 | 1 |
| Sub-Bituminous Coal | 1 | 96,777 | 1.5 | 1 | 2 | 1 |
| Other Bituminous Coal | 1 | 96,796 | 1.5 | 1 | 3 | 1 |
| Other Bituminous Coal | 1 | 98,039 | 1.5 | 1 | 3 | 1 |
| Anthracite | 1 | 98,300 | 1.5 | 1 | 1 | 1 |
| Other Primary Solid Biomass | 30 | 100,000 | 4 | 1 | 3 | 1 |
| Lignite | 1 | 101,000 | 1.5 | 1 | 1 | 1 |
| Lignite | 1 | 103,610 | 1.5 | 1 | 1 | 1 |
| Wood/Wood Waste | 30 | 112,000 | 4 | 1 | 1 | 1 |
| Industrial Wastes | 30 | 143,000 | 4 | 1 | 1 | 1 |
- For DMRE fuel consumption data, the applicable net calorific values, fuel densities, and Tier 1 default or Tier 2 country-specific emission factors were applied to convert fuel quantities to energy units and estimate CO₂, CH₄ and N₂O emissions. The resulting emissions were converted to CO₂e using the global warming potentials adopted for the inventory. Table 1-3 table below shows the fuel properties and emissions factors used to calculate energy sector emissions.
| Fuel | CO₂ (kg/TJ) | CH₄ (kg/TJ) | N₂O (kg/TJ) | ||
|---|---|---|---|---|---|
| DF (Tier 1) | CS (Tier 2) | DF (Tier 1) | DF (Tier 1) | ||
| Liquid | Jet fuel | 71,500 | 73,463 | 3 | 0.6 |
| Aviation Gasoline | 70,000 | 65,752 | 3 | 0.6 | |
| Diesel | 74,100 | 74,638 | 3 | 0.6 | |
| Furnace Oil | 77,400 | 73,090 | 3 | 0.6 | |
| LPG | 63,100 | 64,852 | 1 | 0.1 | |
| Paraffin | 71,900 | 64,640 | 3 | 0.6 | |
| Petrol | 69,300 | 72,430 | 3 | 0.6 | |
| Fuel | NCV | Unit | Density (kg/ℓ) | |
|---|---|---|---|---|
| Liquid | Jet fuel | 37.5 | MJ/ℓ | 0.79 |
| Aviation Gasoline | 33.9 | MJ/ℓ | 0.714 | |
| Diesel | 35.5 | MJ/ℓ | 0.826 | |
| Furnace Oil | 41.60 | MJ/ℓ | 0.990 | |
| LPG | 46.29 | MJ/ℓ | 0.555 | |
| Paraffin | 37.5 | MJ/ℓ | 0.765 | |
| Petrol | 32.5 | MJ/ℓ | 0.741 | |
1.4 Assumptions and Limitations
- The inventory relies on the accuracy and completeness of the SAGERS and DMRE datasets.
- SAGERS-reported emissions were used directly after data checks were performed. The checks focused on ensuring that the data was correctly classified by year, province, municipality and IPCC code.
- DMRE fuel consumption data were disaggregated by fuel type, including jet fuel, aviation gasoline, diesel, petrol, furnace oil, LPG and paraffin. Jet fuel and aviation gasoline were classified under 1A3a Domestic Aviation; diesel and petrol were classified under 1A3b Road Transport; LPG was classified under 1A4a Commercial/Institutional; paraffin was classified under 1A4b Residential; and furnace oil was included under 1A1ai Electricity Generation.
- Extrapolations (SAGERS): Emissions data were available for 2021–2024. 2020 emissions were estimated by applying the arithmetic mean of the available annual emissions for each relevant IPCC source category.
- Extrapolations (DMRE): Fuel consumption data were available for 2020–2023. 2024 fuel quantities were estimated using the arithmetic mean of the available annual fuel consumption, after which emissions were calculated using the applicable emission factors.
2 INDUSTRIAL PROCESSES AND PRODUCT USE (IPPU)
This section describes the methodology and assumptions used to estimate emissions from IPPU. The IPPU sector includes emissions that arise from industrial processes and the use of products, excluding emissions from fuel combustion. This covers process-related emissions from activities such as mineral, chemical and metal production, as well as emissions from product use, including refrigerants and other industrial products where applicable. IPCC IPPU Categories included in the Gauteng GHG inventory:
- 2A3 Glass Production
- 2A4 Other Process Uses of Carbonates
- 2B2 Nitric Acid Production
- 2C1 Iron and Steel Production
- 2C2 Ferroalloys Production
- 2C5 Lead Production
2 INDUSTRIAL PROCESSES AND PRODUCT USE (IPPU)
This section describes the methodology and assumptions used to estimate emissions from IPPU. The IPPU sector includes emissions that arise from industrial processes and the use of products, excluding emissions from fuel combustion. This covers process-related emissions from activities such as mineral, chemical and metal production, as well as emissions from product use, including refrigerants and other industrial products where applicable. IPCC IPPU Categories included in the Gauteng GHG inventory:
- 2A3 Glass Production
- 2A4 Other Process Uses of Carbonates
- 2B2 Nitric Acid Production
- 2C1 Iron and Steel Production
- 2C2 Ferroalloys Production
- 2C5 Lead Production
2.1 Methodology
Industrial Processes and Product Use (IPPU) sector emissions were estimated using emissions data reported through the South African Greenhouse Gas Emissions Reporting System (SAGERS).
The data were then filtered to include the relevant IPPU source categories and aggregated by year and IPCC category. The IPPU sector emissions for Gauteng were reported in carbon dioxide equivalent (CO₂e).
2.2 Activity Data
- No separate activity data were used to calculate IPPU emissions, as the relevant emissions were reported directly through SAGERS. Following data checks, records relating to the applicable IPPU categories were selected and aggregated by inventory year and IPCC category to determine total IPPU emissions for Gauteng
- The SAGERS emissions data and DMRE fuel consumption data used in this inventory are confidential and are not publicly available. The datasets were provided by DFFE to the Province specifically for the preparation of the provincial GHG inventory. Accordingly, only aggregated data and results are presented in this report.
2.3 Emission Factors
- For SAGERS data, emissions were already provided in the dataset. Therefore, no additional emission factors were applied to the SAGERS-reported emissions. SAGERs uses country-specific and IPCC default emission factors, as shown in the table below:
| Fuel | Emission Factors (kg GHG/TJ) | Methodology Tiers | ||||
|---|---|---|---|---|---|---|
| CH₄ | CO₂ | N₂O | CH₄ | CO₂ | N₂O | |
| Natural Gas | 1 | 55,709 | 0.1 | 1 | 2 | 1 |
| Integrated or Tailgas NO2 destruction | 0 | 0 | 0.0025 | 3 | 3 | 3 |
- The IPPU emission factors reported in the SAGERS dataset appear to be incomplete. This is likely because most IPPU emissions were estimated using a Tier 3 approach, which applies facilityspecific activity data and emission factors. As these emission factors are specific to individual facilities, they may not be included in the summary emission factor dataset, potentially due to confidentiality considerations
2.4 Assumptions and Data Limitations
- SAGERs dataset included a category recorded as 1A2n. Following a review of the IPCC Guidelines and relevant supporting material, this category was reclassified under the IPPU sector, specifically under 2A4 Ceramics.
- The inventory relies on the accuracy and completeness of the SAGERs dataset
- Extrapolations (SAGERS): Emissions data were available for 2021–2024. 2020 emissions were estimated by applying the arithmetic mean of the available annual emissions for each relevant IPCC source category.
3 AGRICULTURE
This section describes the methodology and assumptions used to estimate emissions from the agriculture sector. The agriculture sector includes emissions from livestock and agricultural land management activities, excluding emissions from fuel combustion, which are reported under the Energy sector. This covers emissions from activities such as enteric fermentation, manure management, managed soils, crop residues, and the application of lime, where applicable. IPCC Agriculture Categories included in the inventory:
- 3A1 Enteric Fermentation
- 3A2 Manure Management
- 3C2 Liming
- 3C4 Direct N2O emissions from managed soils
- 3C5 Indirect N2O emissions from managed soils
- 3C6 Indirect N2O emissions from manure management
3.1 Enteric Fermentation and Manure Management
Enteric fermentation emissions refer to methane emissions generated during the digestive process of livestock, particularly ruminant animals such as cattle, sheep and goats. In this inventory, enteric fermentation emissions were calculated for cattle, sheep, goats and swine
3.1.1 Methodology
Enteric fermentation emissions were estimated using a Tier 2 approach, consistent with the 2006 IPCC Guidelines for National GHG inventories. The approach applies livestock category-specific emission factors that reflect the characteristics of different animal types, including herd composition.
Annual livestock population data for each livestock category were used as the activity data. South Africa-specific Tier 2 enteric fermentation emission factors, expressed in kg CH₄/head/year, developed by the DFFE, were applied to the corresponding livestock populations. Methane emissions were estimated separately for each livestock category and year by multiplying the livestock population by the applicable emission factor, using the following equation:
CH₄ emissions = Σ (Livestock population × EF_CH₄) × GWP_CH₄- Livestock population
- Number of animals in each livestock category (head)
- EF_CH₄
- Enteric fermentation emission factor (kg CH₄/head/year)
- GWP_CH₄
- 28, the 100-year Global Warming Potential of methane
- CH₄ emissions
- Annual methane emissions expressed as tonnes of carbon dioxide equivalent
3.1.2 Activity Data
- The main activity data used to estimate enteric fermentation emissions are livestock population numbers by animal category. The Department of Agriculture published provincial livestock numbers for cattle, sheep, goats, swine and other livestock categories for the 2020–2024 period. These data provide the total number of animals per province but do not provide the full level of detail required to distinguish between herd composition and breed composition8.
- To further disaggregate the provincial livestock totals, national herd and its composition data were applied. For cattle, the national herd composition was used to estimate the share of bulls, dairy cows, other cows, dairy heifers, other heifers, calves, young oxen and oxen. For sheep and goats, national breed composition data were used to estimate the share of Merino sheep, Karakul sheep, other woolled sheep, non-woolled sheep, Angora goats and other goats9.
- The national composition shares were applied to the provincial livestock totals to derive a more detailed breakdown of livestock categories per province. This approach assumes that the national herd composition is representative of the livestock composition within the province. The resulting disaggregated livestock data were then used as the activity data for estimating enteric fermentation emission, as shown in the table below:
| Gauteng | |||||||||
|---|---|---|---|---|---|---|---|---|---|
| Cattle | |||||||||
| Year | Bulls | Cows over 2 years | Heifers 1 to 2 years | Calves | Young oxen | Oxen | Total | ||
| Dairy | Other | Dairy | Other | ||||||
| 2020 | 6,079 | 31,407 | 84,764 | 7,430 | 23,639 | 72,269 | 10,807 | 9,118 | 245,513 |
| 2021 | 6,130 | 31,670 | 85,133 | 7,492 | 23,497 | 71,852 | 10,897 | 8,854 | 245,524 |
| 2022 | 6,788 | 29,189 | 84,174 | 8,146 | 24,777 | 68,561 | 13,916 | 9,843 | 245,393 |
| 2023 | 6,795 | 32,955 | 78,481 | 10,192 | 24,122 | 71,007 | 13,250 | 8,833 | 245,636 |
| 2024 | 7,135 | 31,936 | 78,141 | 9,853 | 25,481 | 63,872 | 16,987 | 12,231 | 245,636 |
| Gauteng | |||||||
|---|---|---|---|---|---|---|---|
| Year | Sheep | Goat | Swine | ||||
| Merino | Karakul | Other woolled sheep | Non-woolled sheep | Total | Angora | Swine | |
| 2020 | 44,013 | 98 | 16,247 | 23,525 | 83,883 | 21,248 | 154,693 |
| 2021 | 44,017 | 94 | 16,244 | 23,528 | 83,883 | 19,240 | 154,027 |
| 2022 | 44,003 | 94 | 16,242 | 23,521 | 83,859 | 18,137 | 153,999 |
| 2023 | 43,961 | 94 | 16,223 | 23,500 | 83,778 | 18,033 | 153,335 |
| 2024 | 43,919 | 94 | 16,210 | 23,474 | 83,698 | 18,106 | 153,582 |
3.1.3 Emission Factors (Enteric fermentation)
- South Africa-specific enteric fermentation emission factors developed by the Department of Forestry, Fisheries and the Environment (DFFE) were applied for each livestock category. The emission factors used in the inventory to estimate emissions from enteric fermentation are shown in the table below:
| Livestock | Enteric Emission Factorkg CH₄ per head | |
|---|---|---|
| Dairy cattle | Mature cows | 141.07 |
| Heifers | 70.91 | |
| Other cattle | Commercial bulls | 113 |
| Commercial cows | 118.41 | |
| Commercial heifers | 118.41 | |
| Commercial calves | 51.6 | |
| Commercial young ox | 89.4 | |
| Commercial ox | 65.23 | |
| Sheep | Commercial wool | 9.95 |
| Commercial meat | 13.8 | |
| Goat - Angora | Commercial mohair | 6.64 |
| Commercial dairy | 19.99 | |
| Swine | Commercial swine | 1.09 |
3.1.4 Emission Factors (Manure Management)
- South Africa-specific manure management emission factors developed by the Department of Forestry, Fisheries and the Environment (DFFE) were applied for each livestock category. The emission factors used in the inventory to estimate emissions from enteric fermentation are shown in the table below:
| Live stock | Lagoon (%) | Liquid / slurry (%) | Dry lot / Kraals (%) | Solid storage (%) | Daily spread (%) | Compost (%) | Pasture Range Paddock (%) | Ash content of manure | Urinary Energy (% of GE) | Gross Energy (MJ/day) | Feed digestibility (%) | Max CH4 capacity (m3 CH4/kg of VS excreted) | Daily volatile solid excreted (kg dm) |
|---|---|---|---|---|---|---|---|---|---|---|---|---|---|
| Dairy Mature cows | 5 | 5 | 20 | 5 | 5 | 60 | 0.08 | 0.04 | 358.9 | 0.7 | 0.24 | 18.49 | |
| Dairy Heifers | 2 | 98 | 0.08 | 0.04 | 183.57 | 0.7 | 0.13 | 9.46 | |||||
| Commercial Other cattle | 3 | 97 | 0.08 | 0.04 | 255.3 | 0.6 | 0.18 | 13.16 | |||||
| Sheep | 2 | 98 | 0.08 | 0.04 | 20.11 | 0.6 | 0.19 | 1.04 | |||||
| Goats | 2 | 98 | 0.08 | 0.04 | 27.9 | 0.6 | 0.18 | 1.44 | |||||
| Swine | 71 | 11 | 13 | 3 | 2 | 0.17 | 0.02 |
3.1.5 Assumptions and Data Limitations
- Provincial livestock data were available only as total livestock numbers by animal type and no breakdown of herd or breed composition. National herd and breed compositions were therefore applied to disaggregate provincial livestock totals into the animal subcategories required for the emissions calculations. This assumes that the national livestock composition is broadly representative of the composition within Gauteng.
- Provincial goat population data were available only as total goat numbers, with no national composition available to distinguish between commercial mohair and commercial dairy goats. The provincial goat population was therefore assumed to include 50% commercial mohair goats and 50% commercial dairy goats for the application of emission factors. This assumption should be reviewed if more detailed goat composition data become available
- These assumptions should be reviewed and updated when province-specific herd and breed composition data become available
3.2 Liming
Liming emissions refer to carbon dioxide (CO₂) emissions released following the application of carbonate - containing lime to agricultural soils. Lime, including limestone and dolomite, is commonly applied to reduce soil acidity and improve nutrient availability and crop productivity. When these carbonate materials are applied to soil, they dissolve and release carbon dioxide.
3.2.1 Methodology
Liming emissions were estimated as direct carbon dioxide (CO₂) emissions resulting from the application of carbonate-containing lime materials to agricultural soils. Calculations were undertaken for maize, sunflower, soybeans, groundnuts, dry beans, sorghum and wheat for each inventory year from 2020 to 2024.
For each crop, the quantity of lime applied was estimated by multiplying the planted area by the relevant crop-specific lime application rate as determined by Tongwane et al (2016)12. The estimated lime quantity was then apportioned between limestone and dolomite using the assumed share of each material as used by the DFFE.
Separate carbon emission factors were applied to the estimated quantities of limestone and dolomite. The resulting carbon emissions were converted to CO₂ emissions using the molecular weight conversion factor of 44/12, as shown in Equation 3-2 below:
CO₂ emissions = Σ_c (Area_c × Application rate_c × (Limestone share × EF_Limestone + Dolomite share × EF_Dolomite) × 44/12)- c
- Crop type (e.g. maize, wheat, soybeans, sunflower, etc.)
- CO₂ emissions
- Total annual carbon dioxide emissions from liming, expressed as (tCO₂e).
- Area_c
- Area planted for crop c (ha)
- Application rate_c
- Lime application rate for crop c (t lime/ha)
- Limestone share
- Fraction of agricultural lime applied as limestone (37%)
- Dolomite share
- Fraction of agricultural lime applied as dolomite (63%)
- EF_Limestone
- Carbon emission factor for limestone (t C/t limestone)
- EF_Dolomite
- Carbon emission factor for dolomite (t C/t dolomite)
- 44/12
- Molecular weight ratio used to convert carbon (C) to carbon dioxide (CO₂)
Emissions from limestone and dolomite were added to determine total liming emissions for each crop. Crop-level emissions were then aggregated to determine total liming emissions for the province and inventory year.
3.2.2 Activity Data
- Planted area data were used as the primary activity data for estimating liming emissions. Annual planted area data for maize, sunflower, soybeans, groundnuts, dry beans, sorghum and wheat were obtained for Gauteng for the 2020–2024 inventory period13.
- The data were sourced from the Department of Agriculture, Land Reform and Rural Development (DALRRD) Crop Estimates Committee annual area planted and final production estimate reports. Planted area, expressed in hectares, was used to estimate the quantity of lime applied to each crop using the applicable crop-specific lime application rate.
| Province | Crop type | Area planted per crop type (ha) | ||||
|---|---|---|---|---|---|---|
| 2020 | 2021 | 2022 | 2023 | 2024 | ||
| Gauteng | Maize | 105,000 | 108,000 | 112,500 | 108,000 | 116,000 |
| Sunflower | 4,000 | 4,400 | 2,400 | 2,200 | 2,500 | |
| Soybeans | 36,000 | 42,000 | 45,000 | 48,000 | 56,000 | |
| Groundnuts | 0 | 0 | 0 | 0 | 0 | |
| Dry beans | 600 | 840 | 800 | 800 | 850 | |
| Sorghum | 300 | 300 | 200 | 100 | 100 | |
| Wheat | 1,300 | 1,100 | 1,100 | 950 | 1,000 | |
3.2.3 Emission Factors
- Carbon emission factors were applied to estimate direct CO₂ emissions from the application of limestone and dolomite to agricultural soils. The factors were expressed in tonnes of carbon per tonne of lime material and were applied separately to the estimated quantities of limestone and dolomite.
| Lime material | Carbon emission factor | Unit | Sources |
|---|---|---|---|
| Limestone | 0.12 | tC/t | Literature |
| Dolomite | 0.13 | tC/t | Literature |
3.2.4 Assumptions and Data Limitations
- Crop-specific lime application rates, expressed in tonnes of lime per hectare per year, were applied to the planted area data to estimate the total quantity of lime applied to each crop. This assumes that the applicable planted area receives lime at the assumed crop-specific application rate.
| Crop | Lime application rate | Unit | Sources |
|---|---|---|---|
| Maize | 0.50 | t/ha/year | Literature |
| Sunflower | 0.57 | t/ha/year | Literature |
| Soybeans | 0.90 | t/ha/year | Literature |
| Groundnuts | 0.40 | t/ha/year | Literature |
| Drybeans | 0.60 | t/ha/year | Literature |
| Sorghum | 1.15 | t/ha/year | Literature |
| Wheat | 0.63 | t/ha/year | Literature |
- In the absence of province-specific data on the composition of lime products applied, total estimated lime application was assumed to be 37% limestone and 63% dolomite.
- The emissions estimated under this category represent direct CO₂ emissions from lime application to agricultural soils.
3.3 Synthetic Fertilizer Application
Synthetic fertiliser application contributes to nitrous oxide (N₂O) emissions from managed agricultural soils. These emissions arise when nitrogen applied to soils is transformed through microbial processes following fertiliser application.
Application of synthetic fertiliser on the fields results in direct N₂O emissions and indirect N₂O emissions associated with nitrogen losses through volatilisation and leaching or runoff.
The following sections describe the activity data, methodology, emission factors, assumptions and data limitations applied to estimate emissions from synthetic fertiliser use.
3.3.1 Methodology
Synthetic fertiliser application emissions were estimated for the crops included in the inventory using a Tier 1 approach consistent with the 2006 IPCC Guidelines. The methodology covered both direct N₂O emissions from nitrogen applied to managed soils and indirect N₂O emissions resulting from nitrogen losses through volatilisation and leaching.
3.3.1.1 Direct N₂O Emissions from Synthetic Fertiliser Application
Direct N₂O emissions were estimated by first calculating the quantity of nitrogen applied to each crop. This was determined by multiplying the planted area by the applicable nitrogen application rate.
The estimated nitrogen applied was then multiplied by the direct emission factor (EF1) to estimate N₂O-N emissions. These emissions were converted to N₂O using the molecular weight conversion factor of 44/28 and subsequently converted to CO₂e using the global warming potential adopted for the inventory
N₂O emissions = Σ_c (Area_c × N Application rate_c × EF₁ × 44/28 × GWP_N₂O)- c
- Crop type (e.g. maize, wheat, soybeans, sunflower, etc.)
- N₂O emissions
- Total annual direct nitrous oxide emissions from nitrogen application, expressed as tCO₂e
- Area_c
- Area planted for crop c (ha)
- N Application rate_c
- Nitrogen application rate for crop c (kg N/ha)
- EF₁
- Direct emission factor for nitrogen inputs to managed soils (kg N₂O–N/kg N applied)
- 44/28
- Molecular weight ratio used to convert N₂O–N to N₂O
- GWP_N₂O
- 265, the 100-year Global Warming Potential of nitrous oxide
Direct emissions were calculated separately for each crop, province and inventory year, and then aggregated to determine total direct N₂O emissions from synthetic fertiliser application.
3.3.1.2 Indirect N₂O Emissions from Synthetic Fertiliser Application
Indirect N₂O emissions were estimated from nitrogen losses associated with volatilisation and leaching. These losses occur after nitrogen fertiliser is applied to agricultural soils and a portion of the applied nitrogen is transferred to other environmental pathways.
Volatilisation
For volatilisation, the quantity of nitrogen lost as ammonia and nitrogen oxides was estimated by applying the volatilisation fraction (FracGASF) to total nitrogen applied. The resulting nitrogen loss was multiplied by the volatilisation emission factor (EF4) to estimate indirect N₂O–N emissions. These emissions were converted to N₂O using the molecular weight conversion factor of 44/28 and subsequently converted to CO₂e using the global warming potential adopted for the inventory.
N₂O emissions = Σ_c (Area_c × N Application rate_c × Frac_GASF × EF₄ × 44/28 × GWP_N₂O)- c
- Crop type (e.g. maize, wheat, soybeans, sunflower, etc.)
- N₂O emissions
- Total annual indirect nitrous oxide emissions from atmospheric deposition of nitrogen, expressed as tCO₂e
- Area_c
- Area planted for crop c (ha)
- N Application rate_c
- Nitrogen application rate for crop c (kg N/ha)
- Frac_GASF
- Fraction of applied nitrogen that volatilises as NH₃ and NOₓ (kg N volatilised/kg N applied)
- EF₄
- Emission factor for N₂O emissions from atmospheric deposition of volatilised nitrogen (kg N₂O–N/kg NH₃–N and NOₓ–N volatilised)
- 44/28
- Molecular weight ratio used to convert N₂O–N to N₂O
- GWP_N₂O
- 265, the 100-year Global Warming Potential of nitrous oxide
Indirect emissions from nitrogen losses associated with volatilisation were calculated separately for each crop, province and inventory year, and then aggregated to determine total indirect N₂O emissions from synthetic fertiliser application.
Leaching
For leaching, the proportion of nitrogen lost through leaching and runoff was estimated by applying the leaching fraction FracLEACH-(H) to total nitrogen applied. The resulting nitrogen loss was multiplied by the leaching emission factor (EF5) to estimate indirect N₂O–N emissions. These emissions were converted to N₂O using the molecular weight conversion factor of 44/28 and subsequently converted to CO₂e using the global warming potential adopted for the inventory.
N₂O emissions = Σ_c (Area_c × N Application rate_c × Frac_LEACH × EF₅ × 44/28 × GWP_N₂O)- c
- Crop type (e.g. maize, wheat, soybeans, sunflower, etc.)
- N₂O emissions
- Total annual indirect nitrous oxide emissions from nitrogen lost through leaching and runoff, expressed as tCO₂e
- Area_c
- Area planted for crop c (ha)
- N Application rate_c
- Nitrogen application rate for crop c (kg N/ha)
- Frac_LEACH
- Fraction of applied nitrogen lost through leaching and runoff (kg N leached and runoff/kg N applied)
- EF₅
- Emission factor for N₂O emissions resulting from nitrogen lost through leaching and runoff (kg N₂O–N/kg N leached and runoff)
- 44/28
- Molecular weight ratio used to convert N₂O–N to N₂O
- GWP_N₂O
- 265, the 100-year Global Warming Potential of nitrous oxide
Indirect emissions from nitrogen losses associated with leaching were calculated separately for each crop, province and inventory year, and then aggregated to determine total indirect N₂O emissions from synthetic fertiliser application.
3.3.2 Activity Data
- Planted area data was used as the primary activity data for estimating direct and indirect emissions from synthetic fertiliser application. Annual planted area data for maize, sunflower, soybeans, groundnuts, dry beans, sorghum and wheat were obtained for Gauteng for the 2020–2024 inventory period.
- The data is sourced from the Department of Agriculture, Land Reform and Rural Development (DALRRD)15 Crop Estimates Committee annual area planted and final production estimate reports. Planted area, expressed in hectares, was used to estimate the quantity of synthetic fertiliser applied to each crop using the applicable crop-specific N-application rate
- The planted area data used in the synthetic fertiliser calculations are presented in Table 3-4
3.3.3 Emission Factors
- Default emission factors and nitrogen-loss fractions from the 2006 IPCC Guidelines were applied to estimate direct and indirect N₂O emissions from synthetic fertiliser application.
- For direct emissions, the estimated quantity of nitrogen applied to agricultural soils was multiplied by the direct N₂O emission factor, EF1. For indirect emissions, the relevant nitrogen-loss fractions and emission factors were applied to estimate N₂O emissions resulting from volatilisation and leaching or runoff. The emission factors and nitrogen-loss fractions used in the inventory to estimate direct and indirect emissions from synthetic fertiliser application are shown in the table below.
| Emission type | Parameter | Description | Factor | Unit | Source |
|---|---|---|---|---|---|
| Direct | EF1 | Direct N₂O emission factor for N applied to managed soild | 0.01 | (kg N₂O–N) (kg N applied)–1 | IPCC 2006 Guidelines, Chapter 11, Table 11.3 |
| Indirect (Volatilisation) | FracGASF | Fraction of applied nitrogen volatilised as NH₃ and NOₓ | 0.11 | (kg NH₃–N + NOₓ–N) (kg N applied)–1 | IPCC 2006 Guidelines, Chapter 11, Table 11.3 |
| EF4 | N₂O emission factor for volatilised nitrogen | 0.01 | (kg NH₃–N + NOₓ–N) (kg N applied)–1 | IPCC 2006 Guidelines, Chapter 11, Table 11.3 | |
| Indirect (Leaching) | FracLEACH | Fraction of applied nitrogen lost through leaching and runoff | 0.24 | (kg NH₃–N + NOₓ–N) (kg N applied)–1 | IPCC 2006 Guidelines, Chapter 11, Table 11.3 |
| EF5 | N₂O emission factor for nitrogen lost through leaching and runoff | 0.011 | (kg NH₃–N + NOₓ–N) (kg N applied)–1 | IPCC 2006 Guidelines, Chapter 11, Table 11.3 |
3.3.4 Assumptions and Data Limitations
- Crop-specific nitrogen application rates, expressed in kilograms of nitrogen per hectare, were applied to planted area data to estimate the total quantity of synthetic nitrogen fertiliser applied to each crop.
| Crop | N-application rate | Unit | Sources |
|---|---|---|---|
| Maize | 52.8 | kg N/ha | Literature |
| Sunflower | 15.0 | kg N/ha | Literature |
| Soybeans | 19.0 | kg N/ha | Literature |
| Groundnuts | 180.0 | kg N/ha | Literature |
| Drybeans | 24.9 | kg N/ha | Literature |
| Sorghum | 30.0 | kg N/ha | Literature |
| Wheat | 30.0 | kg N/ha | Literature |
3.4 Crop Residues
Crop residue emissions refer to nitrous oxide (N₂O) emissions from managed soils resulting from the decomposition of crop residues following harvest. Crop residues include both above-ground plant material, such as stalks, leaves and husks, and below-ground biomass, including roots. As crop residues decompose, nitrogen contained within the plant material is returned to managed soils, where microbial processes of nitrification and denitrification produce direct N₂O emissions. Indirect N₂O emissions also occur where nitrogen released from crop residues is lost through leaching and runoff.
In this inventory, crop residue emissions were estimated for maize, sunflower, soybeans, groundnuts, dry beans, sorghum and wheat cultivated in Gauteng for the 2020–2024 inventory period.
3.4.1 Methodology
Crop residue emissions were estimated using a Tier 1 approach in accordance with the 2006 IPCC Guidelines for National Greenhouse Gas Inventories (Volume 4, Chapter 11). The methodology is based on estimating the annual amount of nitrogen in crop residues returned to managed soils (FCR), which represents the nitrogen input from crop residues available for nitrification and denitrification. FCR forms the basis for estimating both direct and indirect nitrous oxide (N₂O) emissions from crop residues.
The annual amount of nitrogen in crop residues returned to managed soils (FCR) was estimated separately for each crop type using IPCC Equation 11.6. The calculation accounts for nitrogen contained in both above-ground and below-ground crop residues and incorporates crop-specific production, residue-to-crop production ratios, dry matter fractions, nitrogen contents and residue management parameters.
The estimated FCR per crop is subsequently used to estimate direct and indirect N₂O emissions. Direct emissions were estimated by applying the IPCC default direct emission factor (EF₁) to the total nitrogen input from crop residues, while indirect emissions were estimated by applying the default fraction of nitrogen lost through leaching and runoff (FracLEACH-(H)) together with the corresponding indirect emission factor (EF₅). Nitrous oxide emissions were converted to carbon dioxide equivalent (CO₂e) using a Global Warming Potential (GWP) of 265.
The annual amount of nitrogen in crop residues returned to managed soils (FCR) was estimated using Equation 3-6 below. A summary of the variables and parameters used in the calculation is provided in Table 3-9.
F_CR = Σ_c (Crop_c × Frac_Renew(c) × ((Area_c − Area burnt_c × C_f) × R_AG(c) × N_AG(c) × (1 − Frac_Removed(c)) + Area_c × R_BG(c) × N_BG(c)))- c
- Crop type (e.g. maize, wheat, soybeans, sunflower, etc.)
- F_CR
- Annual amount of N in crop residues (above and below ground) returned to soils (kg N)
- Crop_c
- Harvested annual dry matter yield for crop c, kg d.m. per ha
- Area_c
- Total annual area harvested of crop c, ha
- Area burnt_c
- Annual area of crop c burnt, ha yr-1
- C_f
- Combustion factor
- Frac_Renew(c)
- Fraction of total area under crop c that is renewed annually
- Frac_Removed(c)
- Fraction of above-ground residues of crop c removed annually for purposes such as feed, bedding and construction (kg N)
- R_AG(c)
- Ratio of above-ground residues dry matter
- N_AG(c)
- N content of above-ground residues for crop c (kg N (kg d.m.)-1)
- R_BG(c)
- Ratio of below-ground residues harvested yield for crop c
- N_BG(c)
- N content of below-ground residues for crop c (kg N (kg d.m.)-1)
| # | Variable | Description | Units | Source |
|---|---|---|---|---|
| a | Area planted | Total area planted under crop c, during the inventory year. | Ha | Literature |
| b | Production | Annual production of crop c, calculated from the planted area and crop yield. | t | Literature |
| c | Yield | Harvested fresh yield for crop c | t/ha | Calculated (b ÷ a) |
| d | DRY | Dry matter fraction of harvested crop c | kg d.m | 2019R IPCC, Chapter 11, Table 11.1A |
| e | Crop_c | Harvested annual dry matter yield for crop c | kg/ha | Calculated (c × d) |
| f | R_AG(c) | Ratio of above-ground residue dry matter to harvested yield for crop c | kg d.m. ha-1(kg d.m. ha-1)-1 | 2019R IPCC, Chapter 11, Table 11.1A |
| g | R_S(c) | Ratio of below-ground root biomass to above-ground shoot biomass for crop c | kg d.m. ha-1(kg d.m. ha-1)-1 | 2019R IPCC, Chapter 11, Table 11.1A |
| h | Frac_Renew(c) | Fraction of total area under crop c that is renewed annually | Dimensionless | Expert judgment |
| i | AG_DM(c) | Above-ground residue dry matter for crop c | kg d.m. ha-1 | Calculated (e × f) |
| j | BGR_c | Annual total amount of belowground crop residue for crop c | kg d.m | Calculated ((e + i) × g × a × h) |
| k | N_AG(c) | N content of above-ground residues for crop c | kg N (kg d.m.) -1 | 2019R IPCC, Chapter 11, Table 11.1A |
| l | N_BG(c) | N content of below-ground residues for crop c | kg N (kg d.m.) -1 | 2019R IPCC, Chapter 11, Table 11.1A |
| m | Frac_burnt | Fraction of above-ground crop residues for crop c that are burnt in the field following harvest. | Dimensionless | Expert judgment |
| n | Frac_removed | Fraction of above-ground crop residues of crop c removed annually for purposes such as feed, bedding and construction | Dimensionless | Expert judgment |
| o | R_BG(BIO) | Ratio of below-ground biomass (roots) to harvested crop biomass for crop i. | kg d.m. (kg d.m.)-1 | 2006 IPCC, Chapter 11, Table 11.2 |
| p | R_BG(c) | Ratio of below-ground residues harvested yield for crop c | kg d.m. (kg d.m.)-1 | Calculated ((o × (i × 1000 + e)/e) |
| q | C_f | Combustion factor | Dimensionless | 2019R IPCC, Chapter 2, Table 2.1 |
3.4.1.1 Direct N₂O Emissions from Crop Residues
Direct N₂O emissions from crop residues were estimated by applying the IPCC default direct emission factor (EF₁) to the annual amount of nitrogen in crop residues returned to managed soils (FCR). The resulting N₂O-N emissions were converted to N₂O using the molecular weight ratio of 44/28 and subsequently expressed as carbon dioxide equivalent (CO₂e) using a Global Warming Potential (GWP) of 265
N₂O emissions = Σ_c (F_CR × EF₁ × 44/28 × GWP_N₂O)- c
- Crop type (e.g. maize, wheat, soybeans, sunflower, etc.)
- N₂O emissions
- Total direct nitrous oxide emissions from crop residues, expressed as tCO₂e
- F_CR
- Annual amount of nitrogen in crop residues returned to managed soils (kg N/year)
- EF₁
- IPCC default direct emission factor for nitrogen inputs to managed soils
- 44/28
- Molecular weight ratio used to convert N₂O–N to N₂O.
- GWP_N₂O
- 265, the 100-year Global Warming Potential of nitrous oxide.
Direct emissions were calculated separately for each crop, province and inventory year, and then aggregated to determine total direct N₂O emissions from crop residues.
3.4.1.2 Indirect N₂O Emissions from Crop Residues
Indirect N₂O emissions from crop residues were estimated by applying the IPCC default fraction of nitrogen lost through leaching and runoff FracLEACH and the corresponding indirect emission factor (EF₅) to the annual amount of nitrogen in crop residues returned to managed soils (FCR). This accounts for N₂O emissions resulting from nitrogen that is transported from managed soils through leaching and runoff before undergoing further transformation. The resulting N₂O-N emissions were converted to N₂O and expressed as carbon dioxide equivalent (CO₂e).
N₂O emissions = Σ_c (F_CR × Frac_LEACH × EF₅ × 44/28 × GWP_N₂O)- c
- Crop type (e.g. maize, wheat, soybeans, sunflower, etc.)
- N₂O emissions
- Total direct nitrous oxide emissions from crop residues, expressed as tCO₂e
- F_CR
- Annual amount of nitrogen in crop residues returned to managed soils (kg N/year)
- Frac_LEACH
- Fraction of applied nitrogen lost through leaching and runoff (kg N leached and runoff/kg N applied)
- EF₅
- IPCC default indirect emission factor for nitrogen losses through leaching and runoff
- 44/28
- Molecular weight ratio used to convert N₂O–N to N₂O.
- GWP_N₂O
- 265, the 100-year Global Warming Potential of nitrous oxide.
Indirect emissions from nitrogen losses associated with leaching were calculated separately for each crop, province and inventory year, and then aggregated to determine total indirect N₂O emissions from crop residues.
3.4.2 Activity Data
- The primary activity data used to estimate crop residue emissions were the annual area planted (ha) and crop production (tonnes) for each crop included in the inventory. Area planted data were used to estimate annual crop production, which, together with crop-specific IPCC default parameters, formed the basis for estimating the annual amount of nitrogen in crop residues returned to managed soils (FCR).
- Crop-specific planted area data and production for maize, sunflower, soybeans, groundnuts, dry beans, sorghum and wheat were obtained from the Department of Agriculture for Gauteng for the 2020 - 2024 inventory period. The planted area is presented in Table 3-4 and production data is presented in below:
| Province | Crop type | Production per crop type (tonne) | ||||
|---|---|---|---|---|---|---|
| 2020 | 2021 | 2022 | 2023 | 2024 | ||
| Gauteng | Maize | 627,000 | 751,200 | 764,800 | 756,500 | 700,800 |
| Sunflower | 5,600 | 5,720 | 3,000 | 2,860 | 3,000 | |
| Soybeans | 70,200 | 105,000 | 99,000 | 105,600 | 84,000 | |
| Groundnuts | - | - | - | - | - | |
| Dry beans | 780 | 1,092 | 800 | 880 | 935 | |
| Sorghum | 960 | 1,350 | 800 | 420 | 390 | |
| Wheat | 8,190 | 7,425 | 7,370 | 6,175 | 6,700 | |
3.4.3 Emission Factors
- Default emission factors and nitrogen-loss fractions from the 2006 IPCC Guidelines were applied to estimate direct and indirect N₂O emissions from crop residues.
- For direct emissions, the estimated quantity of nitrogen applied to agricultural soils was multiplied by the direct N₂O emission factor, EF1. For indirect emissions, the relevant nitrogen-loss fractions and emission factors were applied to estimate N₂O emissions resulting from volatilisation and leaching or runoff. The emission factors and nitrogen-loss fractions used in the inventory to estimate direct and indirect emissions from crop residues are shown in Table 3-7.
3.4.4 Assumptions and Data Limitations
- Crop residue emissions were estimated using the IPCC Tier 1 methodology, with crop-specific default parameters for residue-to-crop production ratios, dry matter fractions, nitrogen contents and residue management factors. These default values may not fully reflect local crop varieties and management practices in Gauteng.
- In the absence of province-specific residue management data, the following assumptions were applied based on expert judgement:
- FracRENEW = 1.0, assuming complete annual renewal of the crops included in the inventory.
- FracBURNT = 0.0, assuming that crop residues were not burnt in the field following harvest.
- FracREMOVED = 0.90, assuming that 90% of above-ground crop residues were removed from the field.
- All the above assumptions were applied consistently across all crop types assessed.
The LULUCF sector looks at the changes of carbon stocks in a land use. The 2006 IPCC guidelines recommend that emissions and removals from this sector be calculated using data for at least 20 years. The emissions and removals are calculated for the land use remaining in the same land use and from the land use changes that might have occurred during the period.
4.1.1 Methodology
Emissions and removals were estimated for Forest Land, Cropland, Grassland, Wetlands, Settlements and Other Land. Changes in land area and associated carbon stocks were calculated for land remaining in the same category and land converted between categories. Positive values represent emissions, while negative values represent removals from the atmosphere.
4.1.2 Activity Data
The land use change matrix for the period 1990 – 2020 (Table 4-1) was used to calculate emissions and removals from this sector. The calculations were made for both land use remaining in the same land use, and the land use changes from one land use to the other.
4.1.3 Emission Factors
The sector emission factors were obtained from DFFE and the 1996 IPCC Good Practice Guidelines (Table 4-2)
4.1.4 Assumptions and Data Limitations
- Land-use changes were assessed using the most recent available land-use matrix.
- Emissions and removals were assumed to remain constant after 2020 until updated land-use data become available.
- Default or nationally derived factors were applied where province-specific factors were unavailable.
- The results are subject to uncertainty associated with land classification, mapping accuracy and the availability of province-specific carbon-stock data.
| 1990 Gauteng | Indigenous Forest | Thicket / dense Bush | Natural Wooded Land | Planted Forest | Shrubland | Grasslands | Waterbodies | Wetlands | Barren Land | Eroded Lands | Cultivated commercial permanent orchards | Cultivated commercial permanent vines | Commercial annuals pivot irrigated | Commercial annuals Non-pivot | Cultivated subsistence | Built-up Residential Al | Built-up Smallholdings | Built-up Commercial | Built-up Industrial | Mines | Total 2020 | Total Land Reductions | ||
|---|---|---|---|---|---|---|---|---|---|---|---|---|---|---|---|---|---|---|---|---|---|---|---|---|
| 2020 Gauteng | 1 | 2 | 3 | 4 | 5 | 6 | 7 | 8 | 9 | 10 | 11 | 12 | 13 | 14 | 15 | 16 | 17 | 18 | 19 | 20 | ||||
| FL | Indigenous Forest | 1 | - | - | - | - | - | - | - | - | - | - | - | - | - | - | - | - | - | - | - | - | - | - |
| Thicket / dense Bush | 2 | 0 | 1,245 | 137 | 298 | 16 | 545 | 37 | 454 | - | - | 1 | - | 34 | 167 | 5 | 374 | 141 | 20 | 5 | 7 | 3,488 | 2,243 | |
| Natural Wooded Land | 3 | - | 42,418 | 83,706 | 3,128 | 4,263 | 51,973 | 282 | 6,263 | 42 | 5 | 41 | - | 120 | 7,798 | 304 | 6,697 | 2,553 | 936 | 571 | 1,183 | 212,285 | 22,390 | |
| Planted Forest | 4 | - | 3,302 | 1,516 | 17,064 | 516 | 11,357 | 110 | 1,640 | 23 | 3 | 8 | - | 2 | 1,806 | 27 | 613 | 849 | 20 | 62 | 536 | 39,454 | 22,390 | |
| GL | Shrubland | 5 | - | 48 | 17 | 23 | 83 | 476 | 6 | 14 | 9 | 2 | 0 | - | 2 | 294 | 28 | 27 | 5 | 3 | 13 | 182 | 1,234 | 1,151 |
| Grasslands | 6 | - | 30,932 | 51,279 | 8,150 | 19,805 | 454,638 | 1,349 | 18,843 | 530 | 167 | 73 | - | 413 | 66,892 | 429 | 9,971 | 2,581 | 1,230 | 1,753 | 9,246 | 678,280 | 223,642 | |
| OL | Waterbodies | 7 | - | 663 | 451 | 85 | 63 | 1,486 | 8,249 | 1,046 | 82 | 9 | 0 | - | 1 | 365 | 1 | 119 | 136 | 4 | 3 | 577 | 13,339 | 5,089 |
| Wetlands | 8 | - | 3,609 | 1,340 | 356 | 135 | 8,811 | 601 | 29,611 | 14 | 1 | 3 | - | 15 | 3,115 | 26 | 894 | 505 | 53 | 63 | 257 | 49,411 | 19,800 | |
| Barren Land | 9 | - | 894 | 1,164 | 413 | 2,045 | 8,893 | 195 | 290 | 137 | 21 | 2 | - | 12 | 1,761 | 40 | 425 | 164 | 64 | 160 | 354 | 17,034 | 16,897 | |
| Eroded Lands | 10 | - | 1 | 17 | 0 | 6 | 18 | - | 1 | - | 5 | - | - | - | 0 | - | 1 | - | - | - | 11 | 60 | 55 | |
| CL | Commercial Permanent Orchards | 11 | - | 46 | 57 | 21 | 11 | 196 | 0 | 6 | 0 | - | 445 | - | 4 | 571 | 0 | 20 | 202 | 0 | - | - | 1,580 | 1,136 |
| Commercial Permanent Vines | 12 | - | - | - | - | - | - | - | - | - | - | - | - | - | - | - | - | - | - | - | - | - | - | |
| Commercial Annuals Pivot Irrigated | 13 | - | 215 | 412 | 106 | 120 | 2,583 | 3 | 175 | 0 | - | 1 | - | 5,400 | 16,560 | - | 16 | 113 | 0 | 0 | 3 | 25,708 | 20,308 | |
| Commercial Annuals Non-Pivot | 14 | - | 2,493 | 3,963 | 1,000 | 1,660 | 44,315 | 23 | 2,372 | 7 | 2 | 469 | - | 679 | 284,274 | 183 | 419 | 5,117 | 7 | 11 | 104 | 347,097 | 62,823 | |
| Cultivated Subsistence | 15 | - | 119 | 366 | 22 | 72 | 798 | 3 | 308 | 0 | - | - | - | 40 | 330 | 1,204 | 76 | 32 | 1 | 1 | 3 | 3,374 | 2,171 | |
| SL | Built-up Residential All | 16 | - | 9,746 | 14,593 | 6,076 | 4,185 | 47,773 | 87 | 1,831 | 88 | 7 | 15 | - | 109 | 12,722 | 340 | 129,430 | 9,886 | 1,456 | 319 | 306 | 238,969 | 109,539 |
| Built-up Smallholdings | 17 | - | 375 | 2,162 | 7,231 | 611 | 2,427 | 25 | 114 | 3 | 0 | 2 | - | 2 | 825 | 92 | 1,838 | 97,514 | 46 | 79 | 14 | 113,362 | 15,848 | |
| Built-up Commercial | 18 | - | 733 | 662 | 319 | 359 | 3,178 | 9 | 46 | 23 | 1 | 0 | - | 8 | 488 | 17 | 11,249 | 1,083 | 8,229 | 492 | 7 | 26,902 | 18,672 | |
| Built-up Industrial | 19 | - | 944 | 549 | 317 | 629 | 4,011 | 22 | 96 | 216 | 9 | 16 | - | 57 | 1,253 | 34 | 4,145 | 711 | 180 | 12,474 | 112 | 25,773 | 13,299 | |
| Mines | 20 | - | 994 | 869 | 303 | 205 | 4,566 | 635 | 140 | 68 | 8 | 0 | - | 0 | 1,845 | 18 | 1,140 | 68 | 333 | 310 | 9,955 | 21,159 | 11,205 | |
| Total 1990 | 0 | 98,777 | 163,260 | 44,912 | 34,785 | 648,043 | 11,637 | 63,250 | 1,242 | 240 | 1,076 | - | 6,899 | 491,069 | 2,748 | 167,454 | 121,660 | 12,283 | 16,316 | 12,857 | ||||
| Total Land Lost | 0 | 97,531 | 79,555 | 27,848 | 34,702 | 193,405 | 3,388 | 33,639 | 1,105 | 235 | 631 | - | 1,499 | 116,795 | 1,544 | 38,025 | 24,146 | 4,054 | 3,842 | 12,902 | ||||
Rows are the 2020 class, columns the 1990 class. Totals are as published; several differ by a unit or two from the sum of their own columns.
23| Land Class | Forest type | Biomass growth rate | Root: Shoot ratio | AGB | Dead Wood & litter | Total biomass | Litter | FLU | FMG | FI | Fuel density | Combustion factor | Fuel consumption | Accumulation rate | Half life | Average lifetime | Decay rate | Conversion factor | Total biomass |
|---|---|---|---|---|---|---|---|---|---|---|---|---|---|---|---|---|---|---|---|
| Indigenous forest | Primary (undisturbed) | 0 | 0.27 | 178 | 4.67 | 1 | 1 | 1 | 0.45 | ||||||||||
| Secondary ≥ 20 yrs (disturbed) | 1.7 | ||||||||||||||||||
| Secondary ≤ 20 yrs (disturbed) | 2.9 | ||||||||||||||||||
| Thicket / dense bush | Primary (undisturbed) | 0 | 0.35 | 28.2 | 1.35 | 1 | 1 | 1 | 0.45 | ||||||||||
| Secondary ≥ 20 yrs (disturbed) | 1.2 | ||||||||||||||||||
| Secondary ≤ 20 yrs (disturbed) | 2.4 | ||||||||||||||||||
| Woodlands | Primary (undisturbed) | 0 | 0.25 | 27.2 | 1.01 | 1 | 1 | 1 | 0.56 | ||||||||||
| Secondary ≥ 20 yrs (disturbed) | 0.9 | ||||||||||||||||||
| Secondary ≤ 20 yrs (disturbed) | 1.9 | ||||||||||||||||||
| Plantations | 83.2 | 2.38 | 1 | 1 | 1 | ||||||||||||||
| Annual non-pivot crops | 0.22 | 8.6 | 10 | 3.4 | 5.83 | ||||||||||||||
| Annual pivot crops | 0.22 | 8.6 | 10 | 2.72 | 9.94 | ||||||||||||||
| Subsistence crops | 0.22 | 6.5 | 7.8 | 1.36 | 7.2 | ||||||||||||||
| Orchards | 1.8 | 0.42 | 80.9 | 114.88 | 6.86 | 0.72 | 1 | 1 | 17.45 | ||||||||||
| Vineyards | 0.66 | 0.42 | 29.8 | 42.32 | 9.8 | 0.72 | 1 | 1 | 12.89 | ||||||||||
| Grasslands | 2.6 | 1.86 | 6.7 | 1.55 | 1 | 0.85 | 1 | 3.5 | 0.88 | 3.1 | |||||||||
| Low shrubland | 0.8 | 8.7 | 15.8 | 2.72 | 1 | 1 | 1 | 11.4 | 0.91 | 10.4 | |||||||||
| Eroded land | 0 | 1 | 0.85 | 1 | |||||||||||||||
| Degraded lands | |||||||||||||||||||
| Residential | 5.44 | 2.96 | 5.73 | 0.89 | 5.1 | 2.9 | |||||||||||||
| Smallholdings | 4.77 | 2.4 | 6.03 | 0.89 | 5.47 | 2.9 | |||||||||||||
| Commercial | 2.35 | ||||||||||||||||||
| Industrial | 4.3 | ||||||||||||||||||
| Settlements & mines | 1 | 1 | 1 |
This section describes the methodology, data sources, assumptions, and emission factors used to estimate greenhouse gas (GHG) emissions from the waste sector in the provincial inventory. The waste sector includes emissions associated with the treatment and disposal of solid waste and wastewater. The assessment covers methane (CH₄) and nitrous oxide (N₂O) emissions generated from solid waste disposal, biological treatment of solid waste, wastewater treatment and discharge, and waste incineration, where applicable.
The IPCC waste categories included in the inventory are listed below:
- 4A Solid Waste Disposal
- 4B Biological Treatment of Solid Waste
- 4C Incineration and Open Burning of Waste
- 4D Wastewater Treatment and Discharge
5.1 Solid Waste Disposal
Solid waste disposal emissions arise from the anaerobic decomposition of biodegradable organic material contained in solid waste disposed of at managed disposal sites. As organic waste decomposes in the absence of oxygen, methane (CH₄) is generated and released to the atmosphere over many years. The quantity of methane produced depends on the amount and composition of waste disposed, climatic conditions, waste management practices, and the extent of methane recovery or oxidation occurring at the disposal site.
5.1.1 Methodology
Methane (CH₄) emissions from solid waste disposal were estimated using the Tier 1 methodology described in the 2006 IPCC Guidelines for National Greenhouse Gas Inventories (Volume 5: Waste). Annual municipal solid waste disposal quantities were first estimated using a population-based approach, whereby district population data were used to estimate the quantity of municipal solid waste generated and disposed of at landfill sites. These estimated waste disposal quantities formed the activity data for the emissions calculations.
Annual methane emissions were calculated using the IPCC equation below. A summary of the variables and parameters used in the calculation is provided in the table below.
CH₄ emissions = ((MSW_T × MSW_F × L_O) − R) × (1 − OX) × GWP_CH₄- CH₄ emissions
- Annual methane emissions from solid waste disposal expressed as tCO₂e
- MSW_T
- Total municipal solid waste generated (tonne waste/year)
- MSW_F
- Fraction of municipal solid waste disposed at solid waste disposal sites
- L_O
- Methane generation potential
- R
- Quantity of methane recovered through landfill gas collection systems (Gg CH₄/year)
- OX
- Oxidation factor, representing the fraction of methane oxidised as it passes through the landfill cover (dimensionless)
- GWP_CH₄
- 28, the 100-year Global Warming Potential of methane.
| # | Variable | Description | Units | Source |
|---|---|---|---|---|
| a | MSW_T | Total municipal solid waste generated | Tonnes / year | Calculated using per capita rate (c) and provincial population data. |
| b | MSW_F | Fraction of municipal solid waste disposed at solid waste disposal sites | % | NIR 2019 (2000-2015)/ IPCC 2006 Table 2A.1 |
| c | MSW_GR | Municipal Solid Waste generation rate, South Africa | Tonnes / cap / year | (DFFE)/IPCC 2006 Table 2A.1 |
| d | L_O | Methane generation potential | Dimensionless | SA national GHG inventory 2019 |
| e | R | Methane recovered | Dimensionless | SA national GHG inventory 2019 |
| f | OX | Oxidation factor | Dimensionless | SA national GHG inventory 2019 |
5.1.2 Activity Data
- The activity data required for estimating methane emissions from solid waste disposal consist of annual quantity of municipal solid waste disposed at solid waste disposal sites (MSW_T.) As historical records of waste disposal quantities are not consistently available within the Gauteng Province, annual waste disposal quantities were estimated using district population data and a municipal solid waste generation rate (MSW_GR).
- District population data were obtained from the following sources:
- 2022: Census 2022 Municipal Factsheets (Statistics South Africa).
- 2020 - 2021 and 2023 - 2024: District Population Estimates – Gauteng Report.
- District population data is presented in the table below:
| Province | District | Population | ||||
|---|---|---|---|---|---|---|
| 2020 | 2021 | 2022 | 2023 | 2024 | ||
| Gauteng | Sedibeng | 1,000,171 | 1,009,789 | 1,190,688 | 1,034,347 | 1,047,662 |
| West Rand | 977,228 | 989,498 | 998,465 | 1,016,872 | 1,031,513 | |
| Ekurhuleni | 3,747,451 | 3,804,259 | 4,066,691 | 3,927,835 | 3,993,139 | |
| CoJ | 5,433,108 | 5,517,944 | 4,803,262 | 5,699,663 | 5,798,739 | |
| CoT | 3,626,825 | 3,702,934 | 4,040,315 | 3,866,449 | 3,951,785 | |
- Where district population data were unavailable for a reporting year, population values were extrapolated using the available time series to produce a complete dataset for the inventory period.
- Annual municipal solid waste generation was estimated by multiplying the district population by the municipal solid waste generation rate (MSW_GR), expressed in tonnes of waste generated per capita per year. The MSW_GR values were obtained from the Department of Forestry, Fisheries and the Environment (DFFE), which are based on the 2006 IPCC Guidelines for National Greenhouse Gas Inventories. MSW_GR used in this inventory is 0.398 tonnes/cap/year.
- The resulting activity data (municipal solid waste in tonnes per year) obtained by multiplying the population by the MSW_GR is presented in the table below.
| Province | District | Municipal Solid Waste (tonnes) | ||||
|---|---|---|---|---|---|---|
| 2020 | 2021 | 2022 | 2023 | 2024 | ||
| Gauteng | Sedibeng | 236,054 | 238,324 | 281,019 | 244,120 | 247,263 |
| West Rand | 333,319 | 337,504 | 340,562 | 346,841 | 351,835 | |
| Ekurhuleni | 1,333,388 | 1,353,601 | 1,446,977 | 1,397,571 | 1,420,807 | |
| CoJ | 1,976,413 | 2,007,274 | 1,747,292 | 2,073,378 | 2,109,419 | |
| CoT | 1,180,764 | 1,205,542 | 1,315,381 | 1,258,777 | 1,286,559 | |
5.1.3 Emission Factors
- Methane emissions from solid waste disposal were estimated using the default emission factors and model parameters provided in the 2006 IPCC Guidelines for National Greenhouse Gas Inventories (Volume 5: Waste). Where South African or provincial-specific values were unavailable, IPCC default values were applied in accordance with the Tier 1 methodology.
- The emission factors and variables used in the estimation are presented in Table 5-1
5.1.4 Assumptions and Data Limitations
- Annual municipal solid waste disposal quantities were estimated using district population data and a municipal solid waste generation rate (MSW_GR) due to the limited availability of historical waste disposal records at district level.
- Missing annual population estimates and municipal solid waste generation data were estimated using the average of the available annual values. These estimates were subsequently used to derive activity data for all population-dependent waste source categories.
- Where district population data were unavailable for a reporting year, population values were extrapolated using the available population time series.
- The municipal solid waste generation rate (MSW_GR) was assumed to be representative of waste generation across all districts and reporting years.
- IPCC default emission factors and model parameters were applied in accordance with the Tier 1 methodology where provincial- or country-specific values were unavailable.
5.2 Biological Treatment of Solid Waste
Biological treatment of solid waste includes the controlled biological decomposition of organic waste through processes such as composting and anaerobic digestion. These treatment methods reduce the amount of biodegradable waste disposed of at landfill sites and are used to recover nutrients and, in some cases, energy. Greenhouse gas emissions from biological treatment arise primarily from methane (CH₄) generated during the decomposition of organic waste.
5.2.1 Methodology
Emissions from biological treatment of solid waste were estimated using the Tier 1 methodology described in the 2006 IPCC Guidelines for National Greenhouse Gas Inventories (Volume 5: Waste). Annual quantities of organic waste treated through biological processes were obtained from the South African Waste Information Centre (SAWIC). In the absence of granular information on treatment technologies, it was assumed that 50% of the reported organic waste was treated through composting and 50% through anaerobic digestion. These quantities formed the activity data for the emissions calculations. The equations below were used to estimate the CH₄ emissions and N₂O emissions from biological treatment of waste respectively.
CH₄ emissions = (((0.5 × M × EF_CH₄,C) + (0.5 × M × EF_CH₄,AD)) × 10⁻³ − R) × GWP_CH₄- CH₄ emissions
- Annual methane emissions from biological treatment of waste expressed as tCO₂e
- M
- Total quantity of organic waste treated biologically (tonnes/year)
- EF_CH₄,AD
- Methane emission factor for anaerobic digestion (kg CH₄/tonne waste treated)
- EF_CH₄,C
- Methane emission factor for composting (kg CH₄/tonne waste treated)
- R
- Quantity of methane recovered (Gg CH₄/year)
- GWP_CH₄
- 28, the 100-year Global Warming Potential of methane.
N₂O emissions = ((0.5 × M × EF_N₂O,C) × 10⁻³) × GWP_N₂O- N₄O emissions
- Annual nitrous oxide emissions from biological treatment of waste expressed as tCO₂e
- M
- Total quantity of organic waste treated biologically (tonnes/year)
- EF_N₂O,C
- Nitrous Oxide emission factor for composting (kg N₂O/tonne waste treated)
- GWP_N₂O
- 265, the 100-year Global Warming Potential of methane.
The total GHG emissions (tCO₂e) from biological treatment of solid waste were calculated by summing the methane (CH₄) and nitrous oxide (N₂O) emissions estimated using the equations above.
5.2.2 Activity Data
- The activity data required for estimating emissions from biological treatment of solid waste is the annual quantity of organic waste treated through biological processes. Activity data were obtained from the South African Waste Information Centre (SAWIC).
- Total quantities of waste treated through biological treatment is presented in the table below:
| Province | District | Waste treated through biological treatment (kg) | ||||
|---|---|---|---|---|---|---|
| 2020 | 2021 | 2022 | 2023 | 2024 | ||
| Gauteng | Sedibeng | 26,333 | 26,333 | 67,000 | 8,000 | 4,000 |
| West Rand | 3,296,989 | 3,296,989 | 3,296,989 | 77,020 | 16,414 | |
| Ekurhuleni | 233,884,765 | 213,430,800 | 247,465,260 | 256,749,614 | 321,093,452 | |
| CoJ | 53,249,459 | 29,849,810 | 69,308,509 | 116,324,961 | 130,962,309 | |
| CoT | 52,060,400 | 57,169,100 | 72,545,769 | 64,043,918 | 66,447,040 | |
- The activity data presented above represent the variable M used in the methane (CH₄) and nitrous oxide (N₂O) emission equations.
5.2.3 Emission Factors
- Methane (CH₄) and nitrous oxide (N₂O) emissions from biological treatment of solid waste were estimated using the default emission factors provided in the 2006 IPCC Guidelines for National Greenhouse Gas Inventories (Volume 5: Waste). Separate emission factors were applied for composting and anaerobic digestion to reflect the different emission characteristics of each biological treatment process. Where South African or provincial-specific emission factors were unavailable, the IPCC default values were applied in accordance with the Tier 1 methodology.
- The emission factors used in the estimation are presented below:
| Biological treatment | Variable | Carbon emission factor | Unit | Sources |
|---|---|---|---|---|
| Anaerobic digestion | EF_CH₄,AD | 2 | g CH₄/kg waste treated | DFFE, 2024 |
| Composting | EF_CH₄,C | 10 | g CH₄/kg waste treated | DFFE, 2024 |
| EF_N₂O,C | 6 | g N₂O/kg waste treated | DFFE, 2024 |
5.2.4 Assumptions and Data Limitations
- Annual quantities of organic waste treated through biological processes were obtained from the South African Waste Information Centre (SAWIC).
- The SAWIC only reports the total mass of waste that is biologically treated which is the sum of composting and anaerobic treatment. Owing to this, it was assumed that of the total amount of biologically treated waste, 50% is composted and 50% is treated through anaerobic treatment.
- Methane recovery from anaerobic digestion (R) was assumed to be zero
5.3 Incineration and Open Burning of Waste
Incineration and open burning of waste generate greenhouse gas (GHG) emissions through the combustion of municipal solid waste. Emissions are dependent on the quantity of waste burned and its composition, with different waste fractions producing varying amounts of carbon dioxide (CO₂), methane (CH₄), and nitrous oxide (N₂O). This category includes emissions from the uncontrolled open burning of municipal solid waste where waste collection services are unavailable.
5.3.1 Methodology
Emissions from incineration and open burning of waste were estimated using the Tier 1 methodology described in the 2006 IPCC Guidelines for National Greenhouse Gas Inventories (Volume 5: Waste). In the absence of district-level data on the quantity of waste openly burned, a population-based approach was adopted to estimate the quantity of municipal solid waste subject to open burning.
The methodology consist of the following steps:
Step 1: Estimate the population without access to municipal waste collection services by multiplying the annual district population (
- Table 5-2) by the district-specific percentage of the population without waste collection, obtained from the literature (Table 5-6). The resulting population represents the estimated number of people without access to municipal waste collection services and forms the basis for estimating the quantity of municipal solid waste subject to open burning.
| Province | District | No waste collection (%) |
|---|---|---|
| Gauteng | Sedibeng | 40.7% |
| West Rand | 14.3% | |
| Ekurhuleni | 10.6% | |
| City of Johannesburg | 8.6% | |
| City of Tshwane | 18.2% |
- Step 2: Estimate the quantity of municipal solid waste generated by the population without waste collection services by applying the municipal solid waste generation rate (MSW_GR) (0.398 tonnes/capita/year) adopted from the DFFE methodology, which is based on the 2006 IPCC Guidelines. As shown.
- Step 3: Apply the municipal solid waste composition fractions presented in Table 5-7 to disaggregate the estimated total quantity of municipal solid waste subjected to open burning into the individual waste types (e.g., food, garden waste, paper, wood, textiles, nappies, and plastics). The resulting quantities of each waste type were used as activity data in the emissions calculations.
| Waste type | Waste Fraction (WFi) |
|---|---|
| Food | 0.2 |
| Garden | 0.1 |
| Paper | 0.12 |
| Wood | 0.04 |
| Textile | 0.03 |
| Nappies | 0.18 |
| Plastics, Other inert | 0.33 |
- Step 4: Estimate greenhouse gas emissions from each waste type by applying the Tier 1 equations and emission factors provided in the 2006 IPCC Guidelines, Volume 5: Waste, to the activity data derived in Steps 1 - 3. The IPCC equations used to estimate emissions are presented below. Total emissions were calculated by summing the emissions across all waste types and GHG.
CO₂ emissions = MSW × Σ_i (WF_i × dm_i × CF_i × FCF_i × OF_i) × 44/12- i
- Type of waste open-burned
- CO₂ emissions
- Annual carbon dioxide emissions from incineration and open burning of waste, expressed as tCO₂e
- MSW
- Mass of municipal solid waste open-burned
- WF_i
- Waste fraction
- dm_i
- Dry matter content in the component i of the MSW open-burned, (fraction)
- CF_i
- Fraction of carbon in the dry matter (i.e., carbon content) of component i
- FCF_i
- Fraction of fossil carbon in the total carbon of component i
- OF_i
- Oxidation factor, (fraction) of component i
- 44/12
- Molecular weight ratio used to convert carbon (C) to carbon dioxide (CO₂)
N₂O emissions = Σ_i (IW_i × EF_i) × 0.000001- i
- Type of waste open-burned
- N₂O emissions
- Annual N₂O emissions from incineration and open burning of waste, expressed as tCO₂e
- IW
- Amount of solid waste of type i open-burned, Gg/year
- EF_i
- Emission factor for waste type i, kg N₂O/Gg of waste
- 0.00001
- Conversion factor from kilogram to gigagram
CH₄ emissions = Σ_i (IW_i × EF_i) × 0.000001- i
- Type of waste open-burned
- CH₄ emissions
- Annual CH₄ emissions from incineration and open burning of waste, expressed as tCO₂e
- IW
- Amount of solid waste of type i open-burned, Gg/year
- EF_i
- Emission factor for waste type i, kg CH₄/Gg of waste
- 0.00001
- Conversion factor from kilogram to gigagram
The total greenhouse gas emissions (tCO2e) from incineration and open burning of waste were calculated by summing the methane (CH₄) and nitrous oxide (N₂O) emissions estimated using the equations above.
5.3.2 Activity Data
- The activity data required for estimating emissions from incineration and open burning of waste is the annual quantity of open-burned waste. This is identified by applying the proportion of South African population that has no access to waste collection services to total population from Census, it is assumed that this population fraction practices open burning of waste for Gauteng (Table 5-6)
- The proportions in the table above are applied to total populations in Gauteng, which results in population with no access to waste collection services. To calculate the tonnes of waste burned, a municipal solid waste generation rate of 0.398 tonnes/cap/year was applied.
- The tonnes of waste burned (tonnes) is the primary activity data used in this category.
- Total quantities of waste burned is presented in the table
- Table 5-2 below:
| Province | District | Incineration and open-burned waste (tonnes) | ||||
|---|---|---|---|---|---|---|
| 2020 | 2021 | 2022 | 2023 | 2024 | ||
| Gauteng | Sedibeng | 162,014 | 163,572 | 192,875 | 167,550 | 169,707 |
| West Rand | 55,618 | 56,316 | 56,827 | 57,874 | 58,708 | |
| Ekurhuleni | 158,097 | 160,494 | 171,566 | 165,708 | 168,463 | |
| CoJ | 185,964 | 188,868 | 164,406 | 195,088 | 198,479 | |
| CoT | 262,713 | 268,226 | 292,664 | 280,070 | 286,251 | |
- The activity data presented above represent the variable M used in the methane (CH₄) and nitrous oxide (N₂O) emission equations.
5.3.3 Emission Factors
- GHG emissions from burned waste were estimated using the default emission factors and model parameters provided in the 2006 IPCC Guidelines for National Greenhouse Gas Inventories (Volume 5: Waste). Where South African or provincial-specific values were unavailable, IPCC default values were applied in accordance with the Tier 1 methodology.
5.3.4 Assumptions and Data Limitations
- Annual municipal solid waste disposal quantities were estimated using district population data and a municipal solid waste generation rate (MSW_GR) due to the limited availability of historical waste disposal records at the district level.
- Missing annual population estimates and municipal solid waste generation data were estimated using the average of the available annual values. These estimates were subsequently used to derive activity data for all population-dependent waste source categories.
- Where district population data were unavailable for a reporting year, population values were extrapolated using the available population time series.
- The municipal solid waste generation rate (MSW_GR) was assumed to be representative of waste generation across all districts and reporting years.
- IPCC default emission factors and model parameters were applied in accordance with the Tier 1 methodology where provincial- or country-specific values were unavailable.
Scope 2 emissions are indirect GHG emissions associated with grid-supplied electricity purchased and consumed within the province. Although the emissions occur at electricity-generation facilities, they are attributed to the province because they result from electricity consumption within its boundary.
6.1 Methodology
Scope 2 emissions were calculated by multiplying annual provincial electricity consumption by the Eskom-reported grid emission factor (Equation 6-1). As the grid emission factor is expressed in tonnes of carbon dioxide equivalent per megawatt-hour (tCO₂e/MWh), electricity consumption reported in gigawatt-hours (GWh) was converted to megawatt-hours (MWh) before applying the grid emission factor. The calculation produces emissions directly in tCO₂e. Therefore, no additional conversion using global warming potentials (GWPs) was required.
Scope 2 emissions = Electricity consumption × Grid Emission Factor- Scope 2 emissions
- Indirect electricity-related emissions, expressed in tCO₂e
- Electricity consumption
- Grid-supplied electricity consumed within the province, expressed in MWh
- Grid emissions factor
- Eskom-reported grid emission factor, expressed in tCO₂e/MWh
6.2 Activity Data
- The activity data used to estimate Scope 2 emissions were monthly electricity consumption data by province, obtained from Statistics South Africa’s Electricity Generated and Available for Distribution (P4141) dataset.
- Monthly electricity consumption, reported in gigawatt-hours (GWh), was aggregated to determine the total annual electricity consumed within the province for each year from 2020 to 2024.
- The annual electricity consumption was converted from GWh to megawatt-hours (MWh) before applying the corresponding annual Eskom grid emission factor. The annual electricity consumption values used in the calculations are presented in the table below.
| Parameter | Unit | 2020 | 2021 | 2022 | 2023 | 2024 |
|---|---|---|---|---|---|---|
| Electricity consumption | GWh | 57,203 | 57,913 | 54,781 | 51,819 | 53,289 |
6.3 Emission Factors
- Annual grid emission factors reported by Eskom were used to estimate Scope 2 emissions. The applied factors are based on Eskom’s total electricity sales and the total electricity available for distribution after excluding technical transmission and distribution (T&D) losses.
- A separate emission factor was applied to each inventory year to reflect annual changes in the emissions intensity of grid-supplied electricity (Table 6-2). The factors are expressed in tCO₂e/MWh and therefore produce Scope 2 emissions directly in tCO₂e, with no additional GWP conversion required.
| Year | Eskom Factor 1: Based on total electricity sales by Eskom, total available for distribution, after excluding technical losses through T&D | ||
|---|---|---|---|
| Units | Emission Factor | Source | |
| 2020 | tCO₂e/MWh | 1.080 | Eskom Integrated Report 2021 |
| 2021 | tCO₂e/MWh | 1.040 | Eskom Integrated Report 2022 |
| 2022 | tCO₂e/MWh | 1.010 | Eskom Integrated Report 2023 |
| 2023 | tCO₂e/MWh | 1.060 | Eskom Integrated Report 2024 |
| 2024 | tCO₂e/MWh | 1.080 | Eskom Integrated Report 2025 |
6.4 Assumptions and Data Limitations
- Electricity consumption data were available only at the provincial level and were not disaggregated by district municipality. Scope 2 emissions could therefore not be estimated separately for each district within the province.
Scope 3 emissions are indirect GHG emissions associated with activities occurring outside the provincial boundary but attributable to activities within the province. The Scope 3 sources included in this inventory were electricity transmission and distribution (T&D) losses and waste imported into Gauteng for disposal.
7.1 Electricity Transmission and Distribution Losses
Electricity transmission and distribution (T&D) losses occur when a portion of the electricity supplied through the national grid is lost before reaching end users. The emissions associated with generating this lost electricity occur outside the provincial boundary and are therefore reported as Scope 3 emissions.
7.1.1 Methodology
Scope 3 emissions from electricity T&D losses were calculated by multiplying annual provincial electricity consumption by the applicable annual electricity loss rate and Eskom grid emission factor. Electricity consumption was converted from gigawatt-hours (GWh) to megawatt-hours (MWh) before applying the emission factor.
Scope 3 emissions (T&D losses) = Electricity consumption × T&D loss rate × Grid Emission Factor- T&D loss emissions
- emissions associated with electricity lost during transmission and distribution (tCO₂e)
- Electricity consumption
- Grid-supplied electricity consumed within the province, expressed in MWh
- T&D loss rate
- Grid-supplied electricity consumed within the province, expressed in MWh
- Grid emissions factor
- Eskom-reported grid emission factor, expressed in tCO₂e/MWh
The grid emission factor is expressed in tCO₂e/MWh; therefore, the calculation produces emissions directly in tCO₂e and no GWP is applied.
7.1.2 Activity Data
- Annual provincial electricity consumption was used as the primary activity data. The annual T&D factors presented in the table below were calculated by dividing Eskom’s total electricity available for distribution by its total electricity sold.
| Year | Distribution | Transmission | Total available for distribution GWh | Total electricity sold (GWh) | Source | Total Dist / Total Sold |
|---|---|---|---|---|---|---|
| 2019 | 7.6 | 2.2 | 237,215 | 214,121 | Eskom IR 2024 | 1.108 |
| 2020 | 7.7 | 2 | 235,486 | 212,190 | Eskom IR 2024 | 1.110 |
| 2021 | 8.5 | 2.2 | 234,407 | 208,319 | Eskom IR 2024 | 1.125 |
| 2022 | 8.8 | 2.2 | 231,356 | 205,635 | Eskom IR 2024 | 1.125 |
| 2023 | 10.1 | 2.3 | 219,423 | 191,852 | Eskom IR 2024 | 1.144 |
| 2024 | 9.6 | 2.3 | 226,226 | 198,281 | Eskom IR 2024 | 1.141 |
| 2025 | 9.7 | 2.3 | 215,319 | 188,401 | Eskom IR 2024 | 1.143 |
| 2026 | 9.9 | 2.2 | 210,648 | 183,311 | Eskom IR 2024 | 1.149 |
- Each factor was applied to provincial electricity consumption to estimate the total electricity supplied, including losses. Electricity lost during transmission and distribution was then calculated as the difference between the estimated total electricity supplied and the electricity consumed. The calculated energy losses are shown below:
| Parameter | Unit | 2020 | 2021 | 2022 | 2023 | 2024 |
|---|---|---|---|---|---|---|
| T&D losses | GWh | 7,155 | 8,323 | 7,721 | 7,404 | 7,947 |
7.1.3 Emission Factors
- Annual Eskom grid emission factors were applied to the estimated quantity of electricity lost during transmission and distribution.
7.1.4 Assumptions and Data Limitations
- Electricity consumption data were available at the provincial level and could not be disaggregated by district municipality.
7.2 Waste Imported for Disposal
Waste imported into Gauteng refers to waste generated outside the provincial boundary and transported into the province for disposal. Although the associated emissions occur within Gauteng, they are attributable to waste-generating activities outside the province and are therefore reported as Scope 3 emissions
7.2.1 Methodology
Scope 3 emissions from imported waste were estimated using the annual quantity of waste imported into Gauteng for disposal. The imported waste quantities were assessed using the solid waste disposal methodology described in Section 5.1, applying the relevant emission factors and model parameters to estimate the associated methane emissions.
7.2.2 Activity Data
- The activity data used were the annual tonnes of waste imported into Gauteng for disposal during the 2020–2024 inventory period. The imported waste quantities used in the calculations are presented in the table below:
| Parameter | Unit | 2020 | 2021 | 2022 | 2023 | 2024 |
|---|---|---|---|---|---|---|
| Imported waste (Landfilled) | tonnes | 5,575 | 58,117 | 6,535 | 5,782 | 23,226 |
7.2.3 Emission Factors
- The emission factors and model parameters applied to imported waste were consistent with those used to estimate emissions from solid waste disposal, as presented in Section 5.1.3.
7.2.4 Assumptions and Data Limitations
- Imported waste was assumed to have the same composition and disposal characteristics as waste generated and disposed of within Gauteng.
- Detailed information on the composition of imported waste and the specific disposal facilities receiving it was unavailable.
- The estimates were limited to the reported quantities of waste imported into Gauteng for disposal.
- Department of Agriculture, Land Reform and Rural Development (DALRRD). 2020–2024. Crop Estimates Committee annual area planted and final production estimate reports.
- Department of Agriculture. 2025. Livestock Numbers from 1996 to Current. Available at: https://www.nda.gov.za/images/Branches/Economica%20Development%20Trade%20and%20Marketing/Statistc%20and%20%20Economic%20Analysis/statistical-information/livestock/2025/livestock-numbers-from-1996-to-current.xls (accessed June 2026).
- Department of Agriculture. 2025. Abstract of Agricultural Statistics 2025. Available at: https://www.nda.gov.za/images/Branches/Economica%20Development%20Trade%20and%20Marketing/Statistc%20and%20%20Economic%20Analysis/economic-analysis/abstract-2025.pdf (accessed June 2026).
- Department of Forestry, Fisheries and the Environment (DFFE). 2026. National Greenhouse Gas Inventory Report. Available at: https://www.gov.za/sites/default/files/gcis_document/202606/54758gon7537.pdf (accessed June 2026).
- Department of Forestry, Fisheries and the Environment (DFFE). South African Greenhouse Gas Emissions Reporting System (SAGERS), fuel properties and emission factors dataset. Data provided to the Gauteng Province for preparation of the provincial GHG inventory.
- Department of Mineral Resources and Energy (DMRE). SA Fuel Sales Volume Data: Quarterly Disaggregated Fuel Sales Volume Data (Magisterial District Level). Available at: https://www.dmpr.gov.za/Portals/0/Energy_Website/files/energyStats_frame.html (accessed June 2026).
- Intergovernmental Panel on Climate Change (IPCC). 2006. 2006 IPCC Guidelines for National Greenhouse Gas Inventories, Volumes 1–5. Available at: https://www.ipcc-nggip.iges.or.jp/public/2006gl/ (accessed June 2026).
- Tongwane, M., Mdlambuzi, T., Moeletsi, M., Tsubo, M., Mliswa, V. and Grootboom, L. 2016. Greenhouse gas emissions from different crop production and management practices in South Africa. Environmental Development, 19, 23–35. Available at: https://doi.org/10.1016/j.envdev.2016.06.004
- World Resources Institute (WRI), C40 Cities Climate Leadership Group and ICLEI – Local Governments for Sustainability. 2014. Global Protocol for Community-Scale Greenhouse Gas Emission Inventories: An Accounting and Reporting Standard for Cities. Available at: https://ghgprotocol.org/sites/default/files/standards/GPC_Full_MASTER_RW_v7.pdf (accessed June 2026).